
Onboarding Guide
This guide walks you through setting up Monoscope: create an account, get an API key, integrate an SDK, and start monitoring your API. The whole process takes about 5 minutes.
Prefer video? Here’s a walkthrough:
Steps
① Create an Account
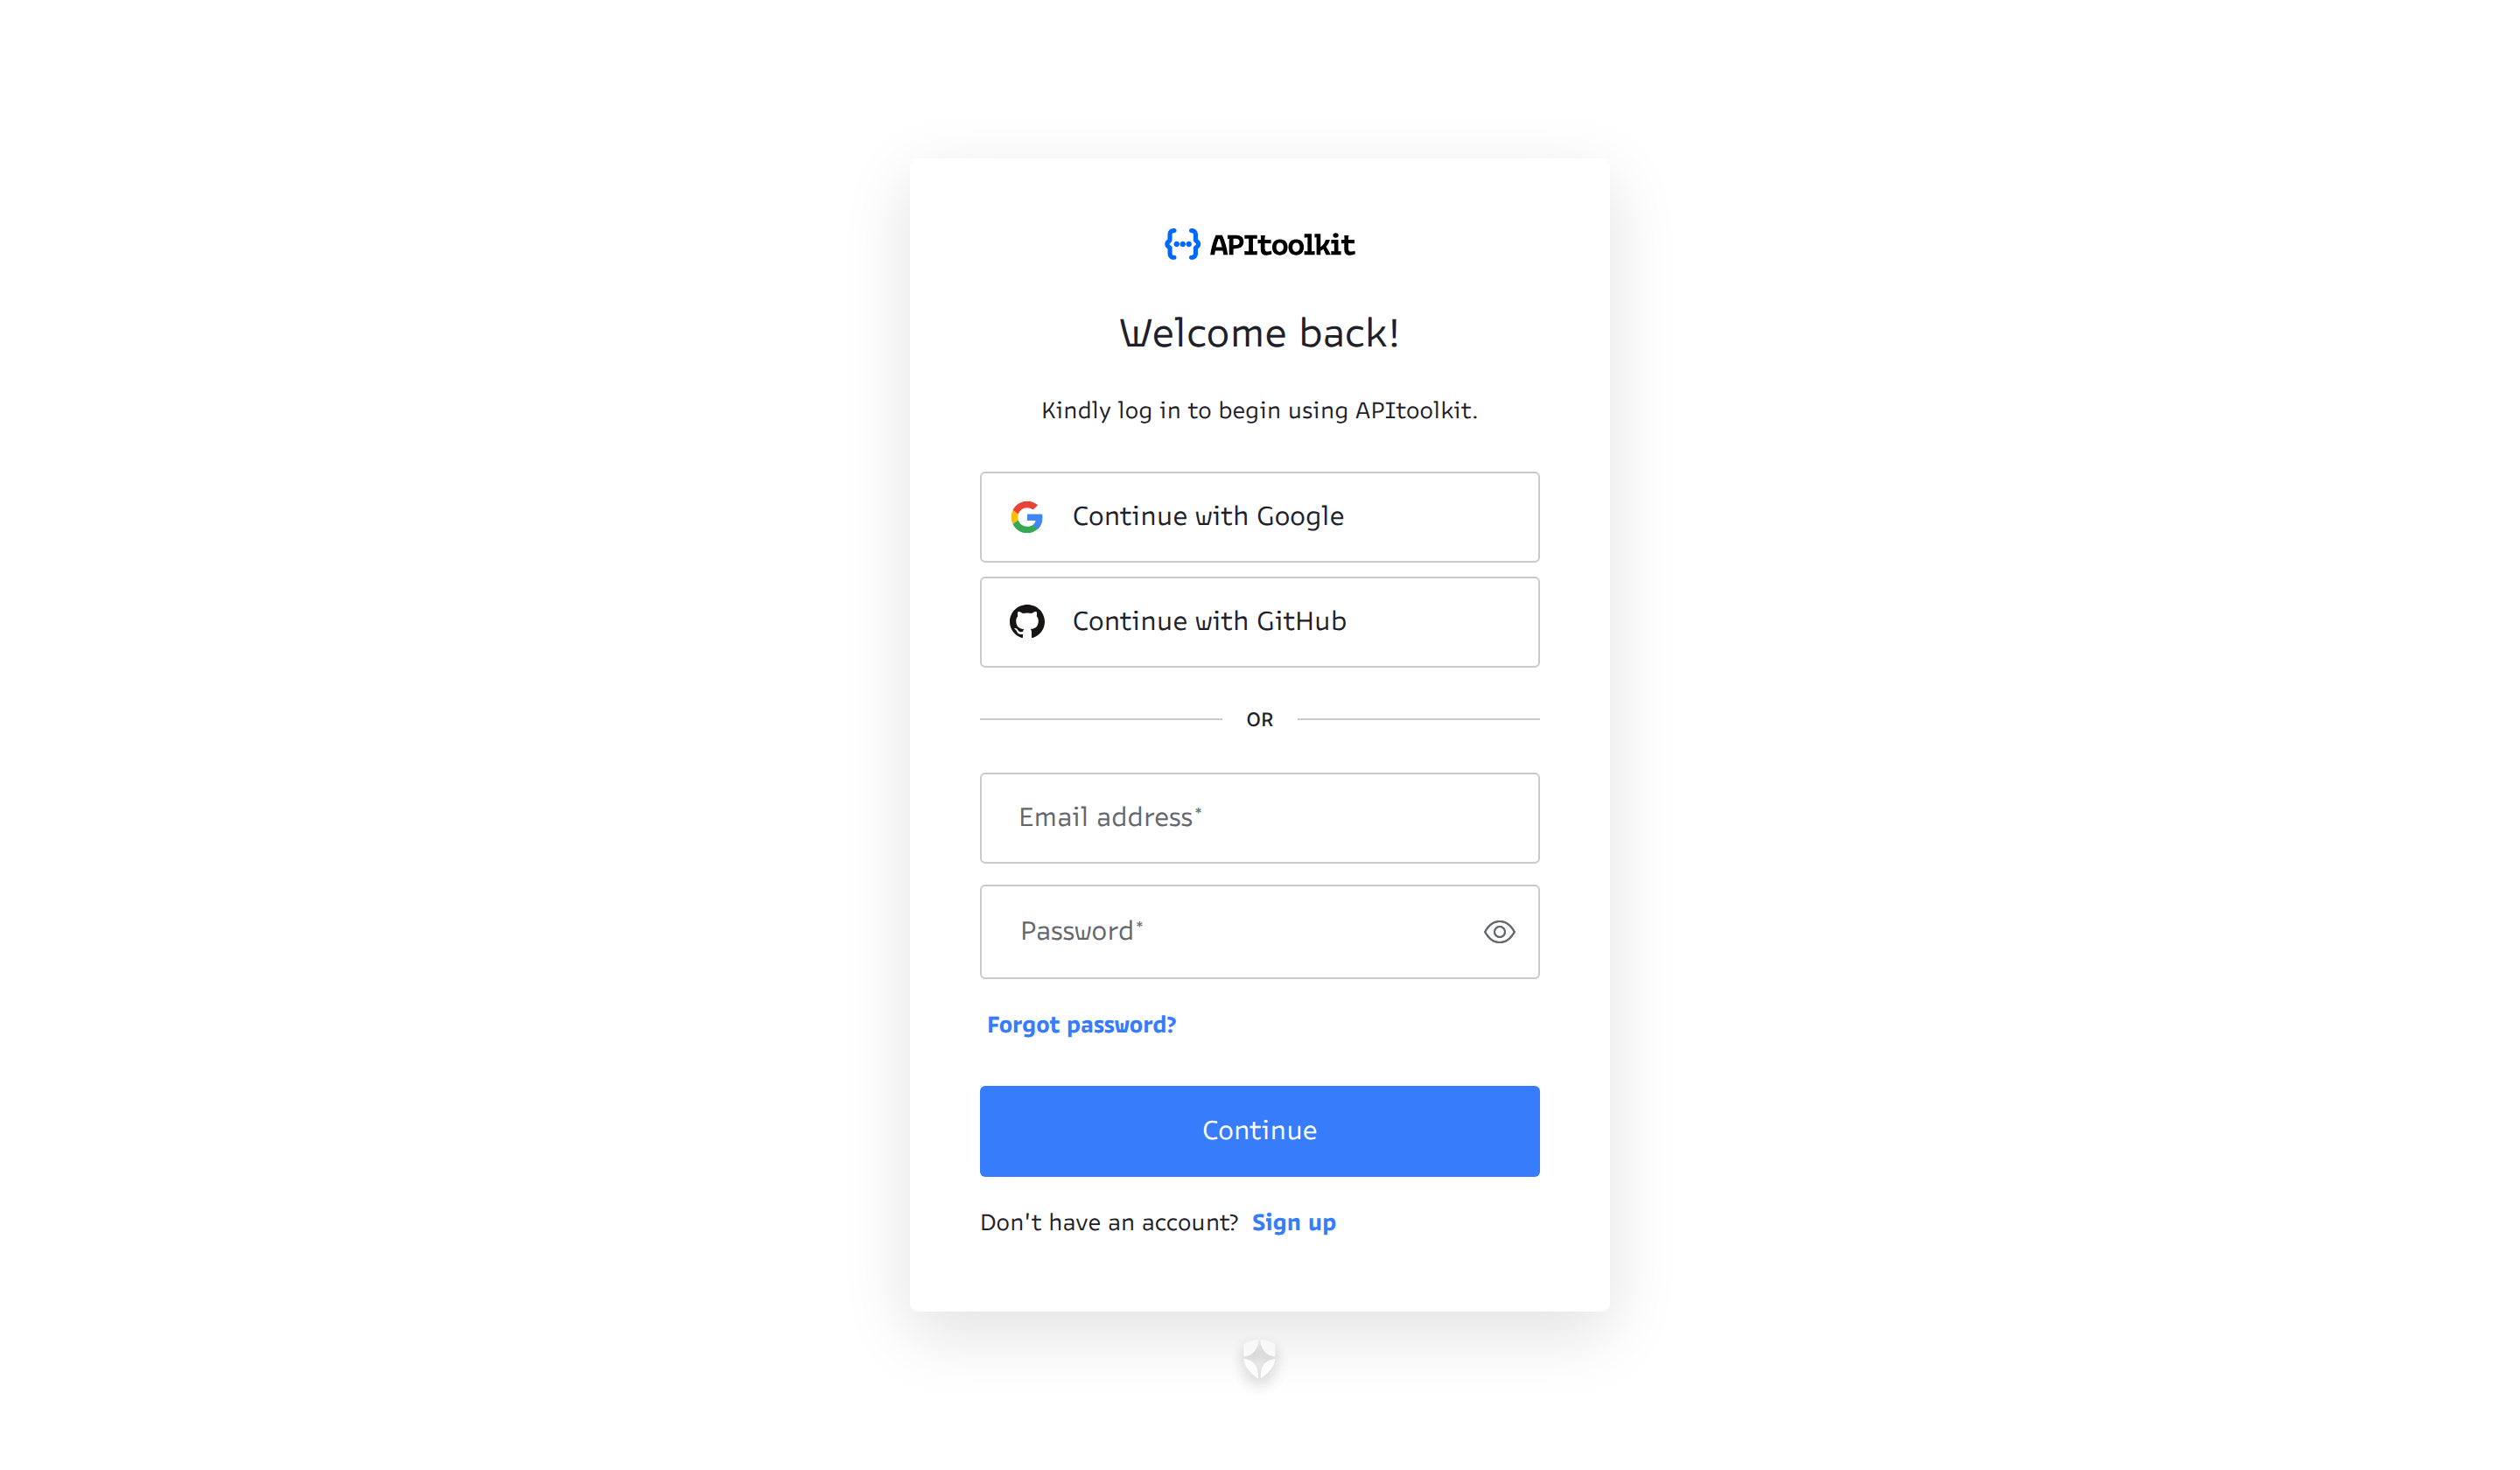
Sign up at app.monoscope.tech using Google, GitHub, or email.
② Create a New Project
After signing up, you’ll be guided through creating your first project. You can update all of these values later.
-
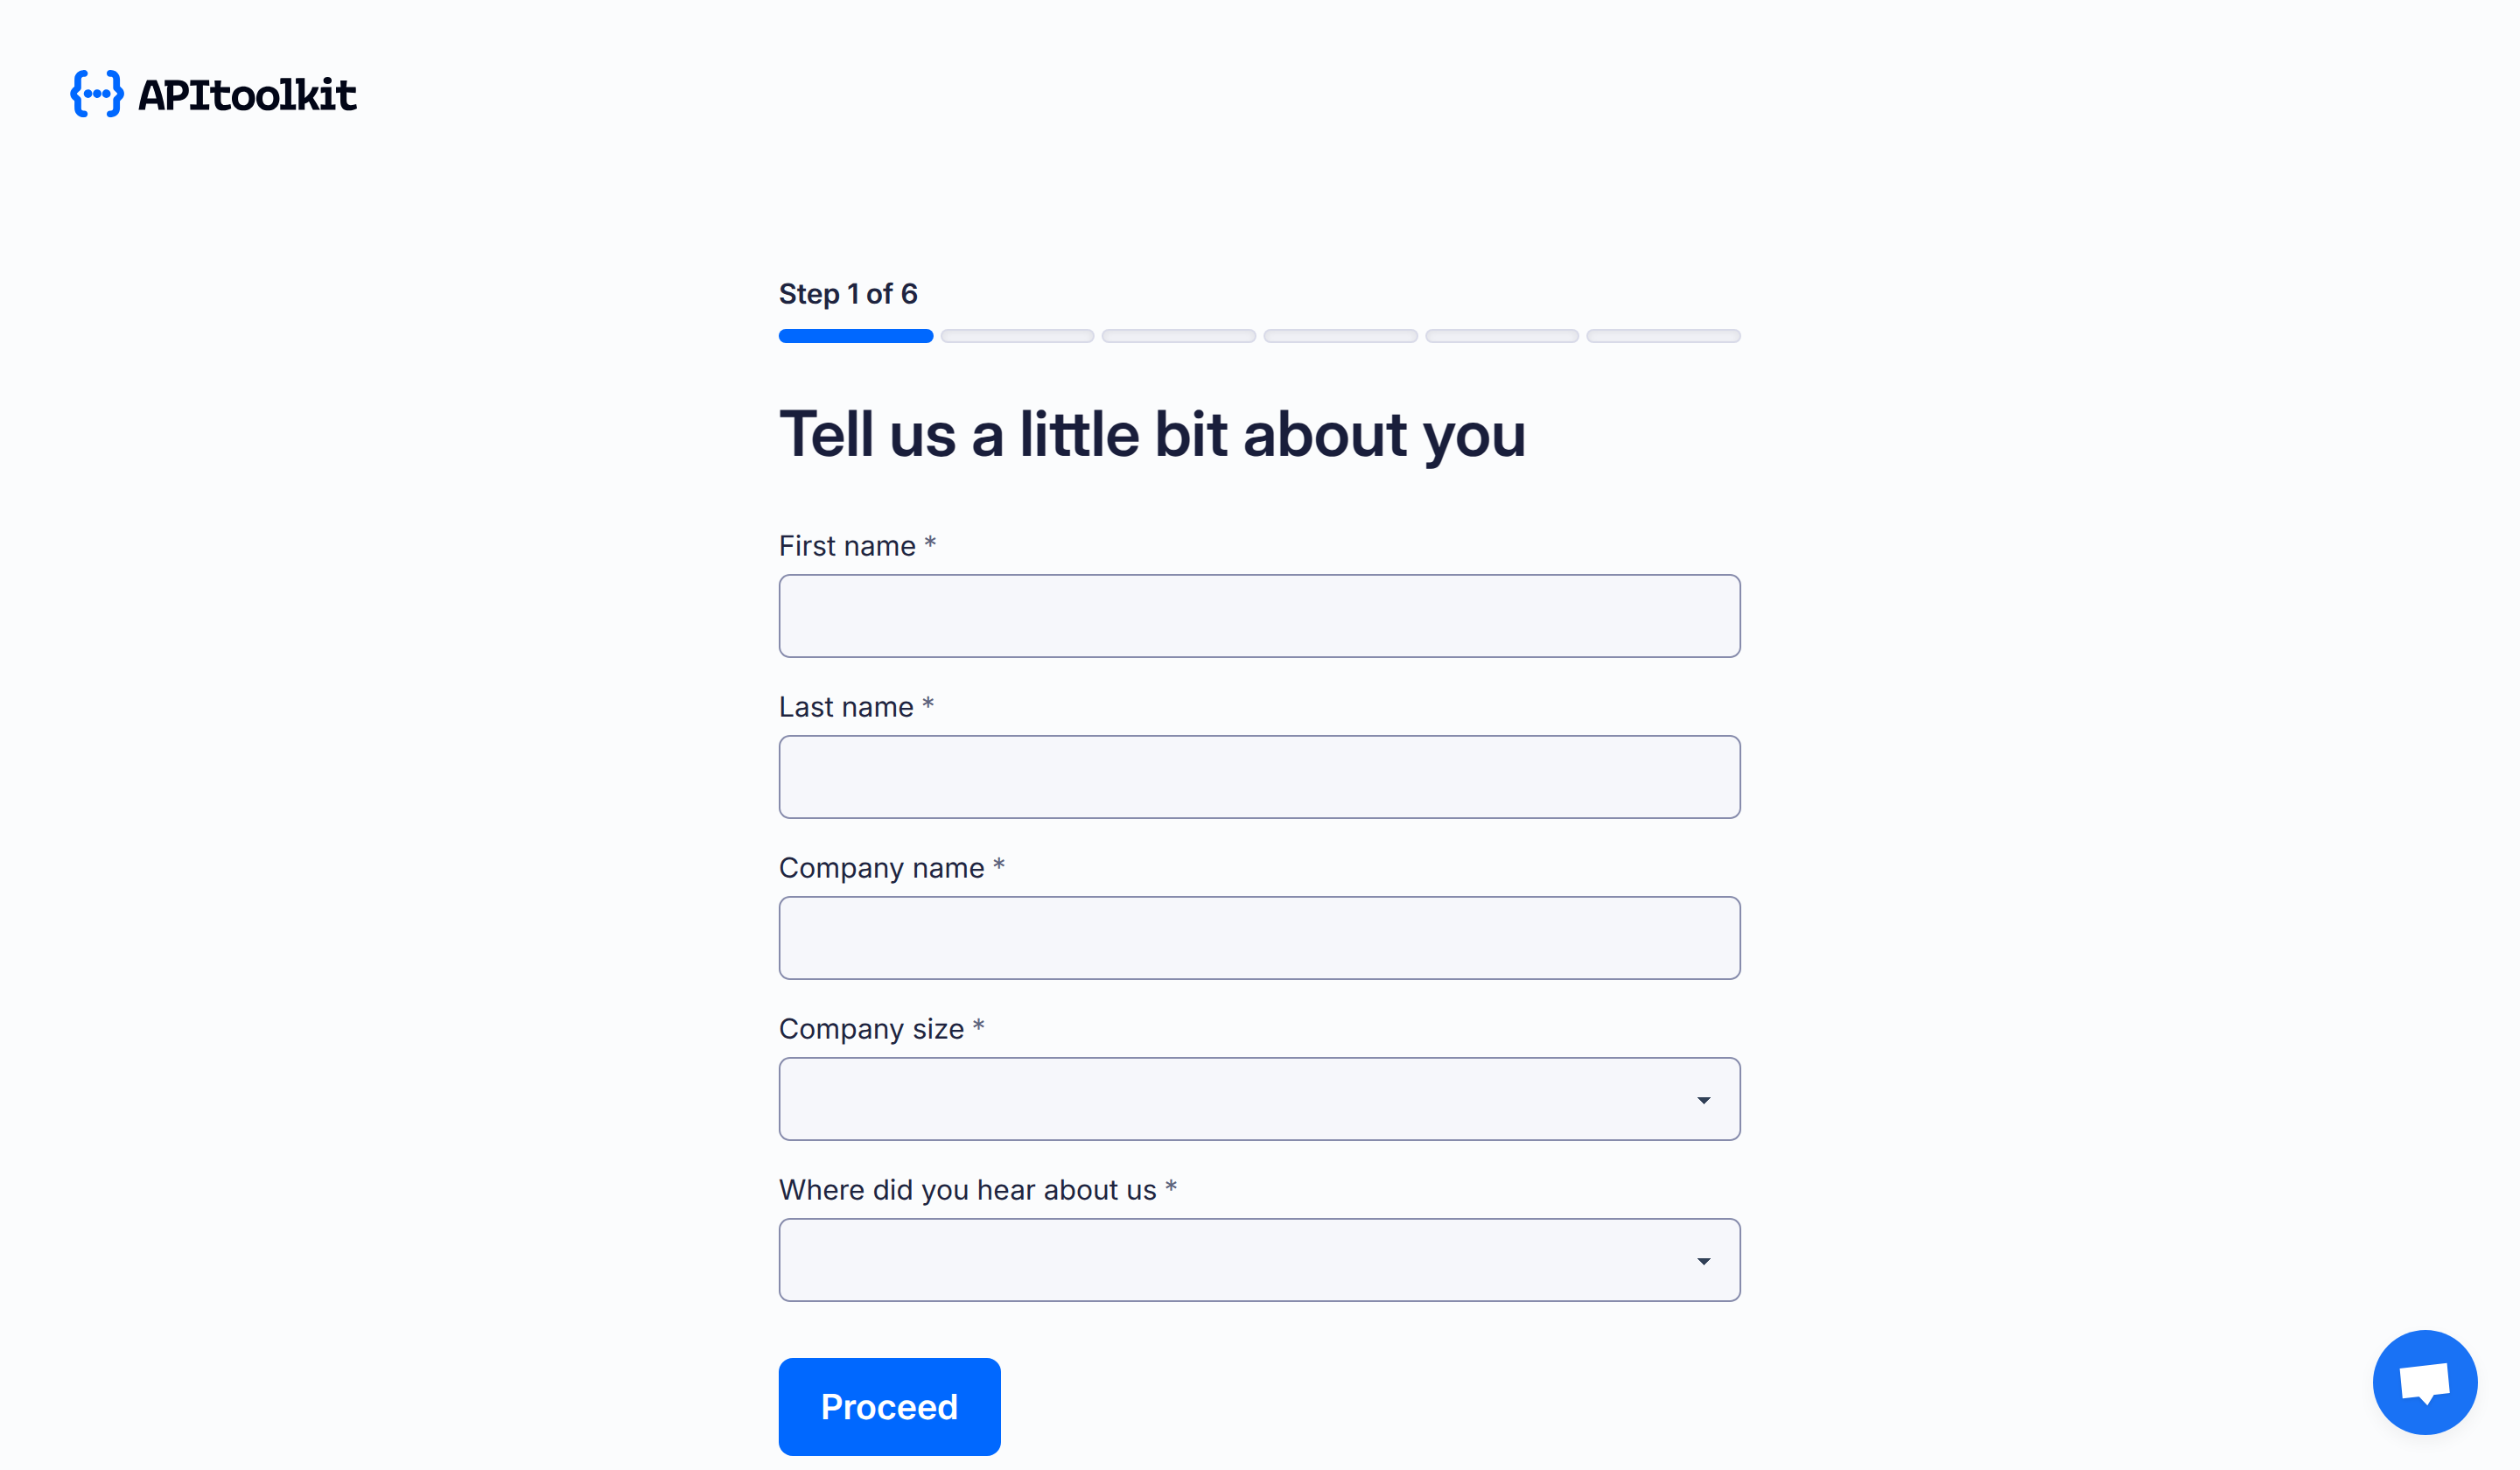
About you: A quick survey to help us tailor your experience.
-
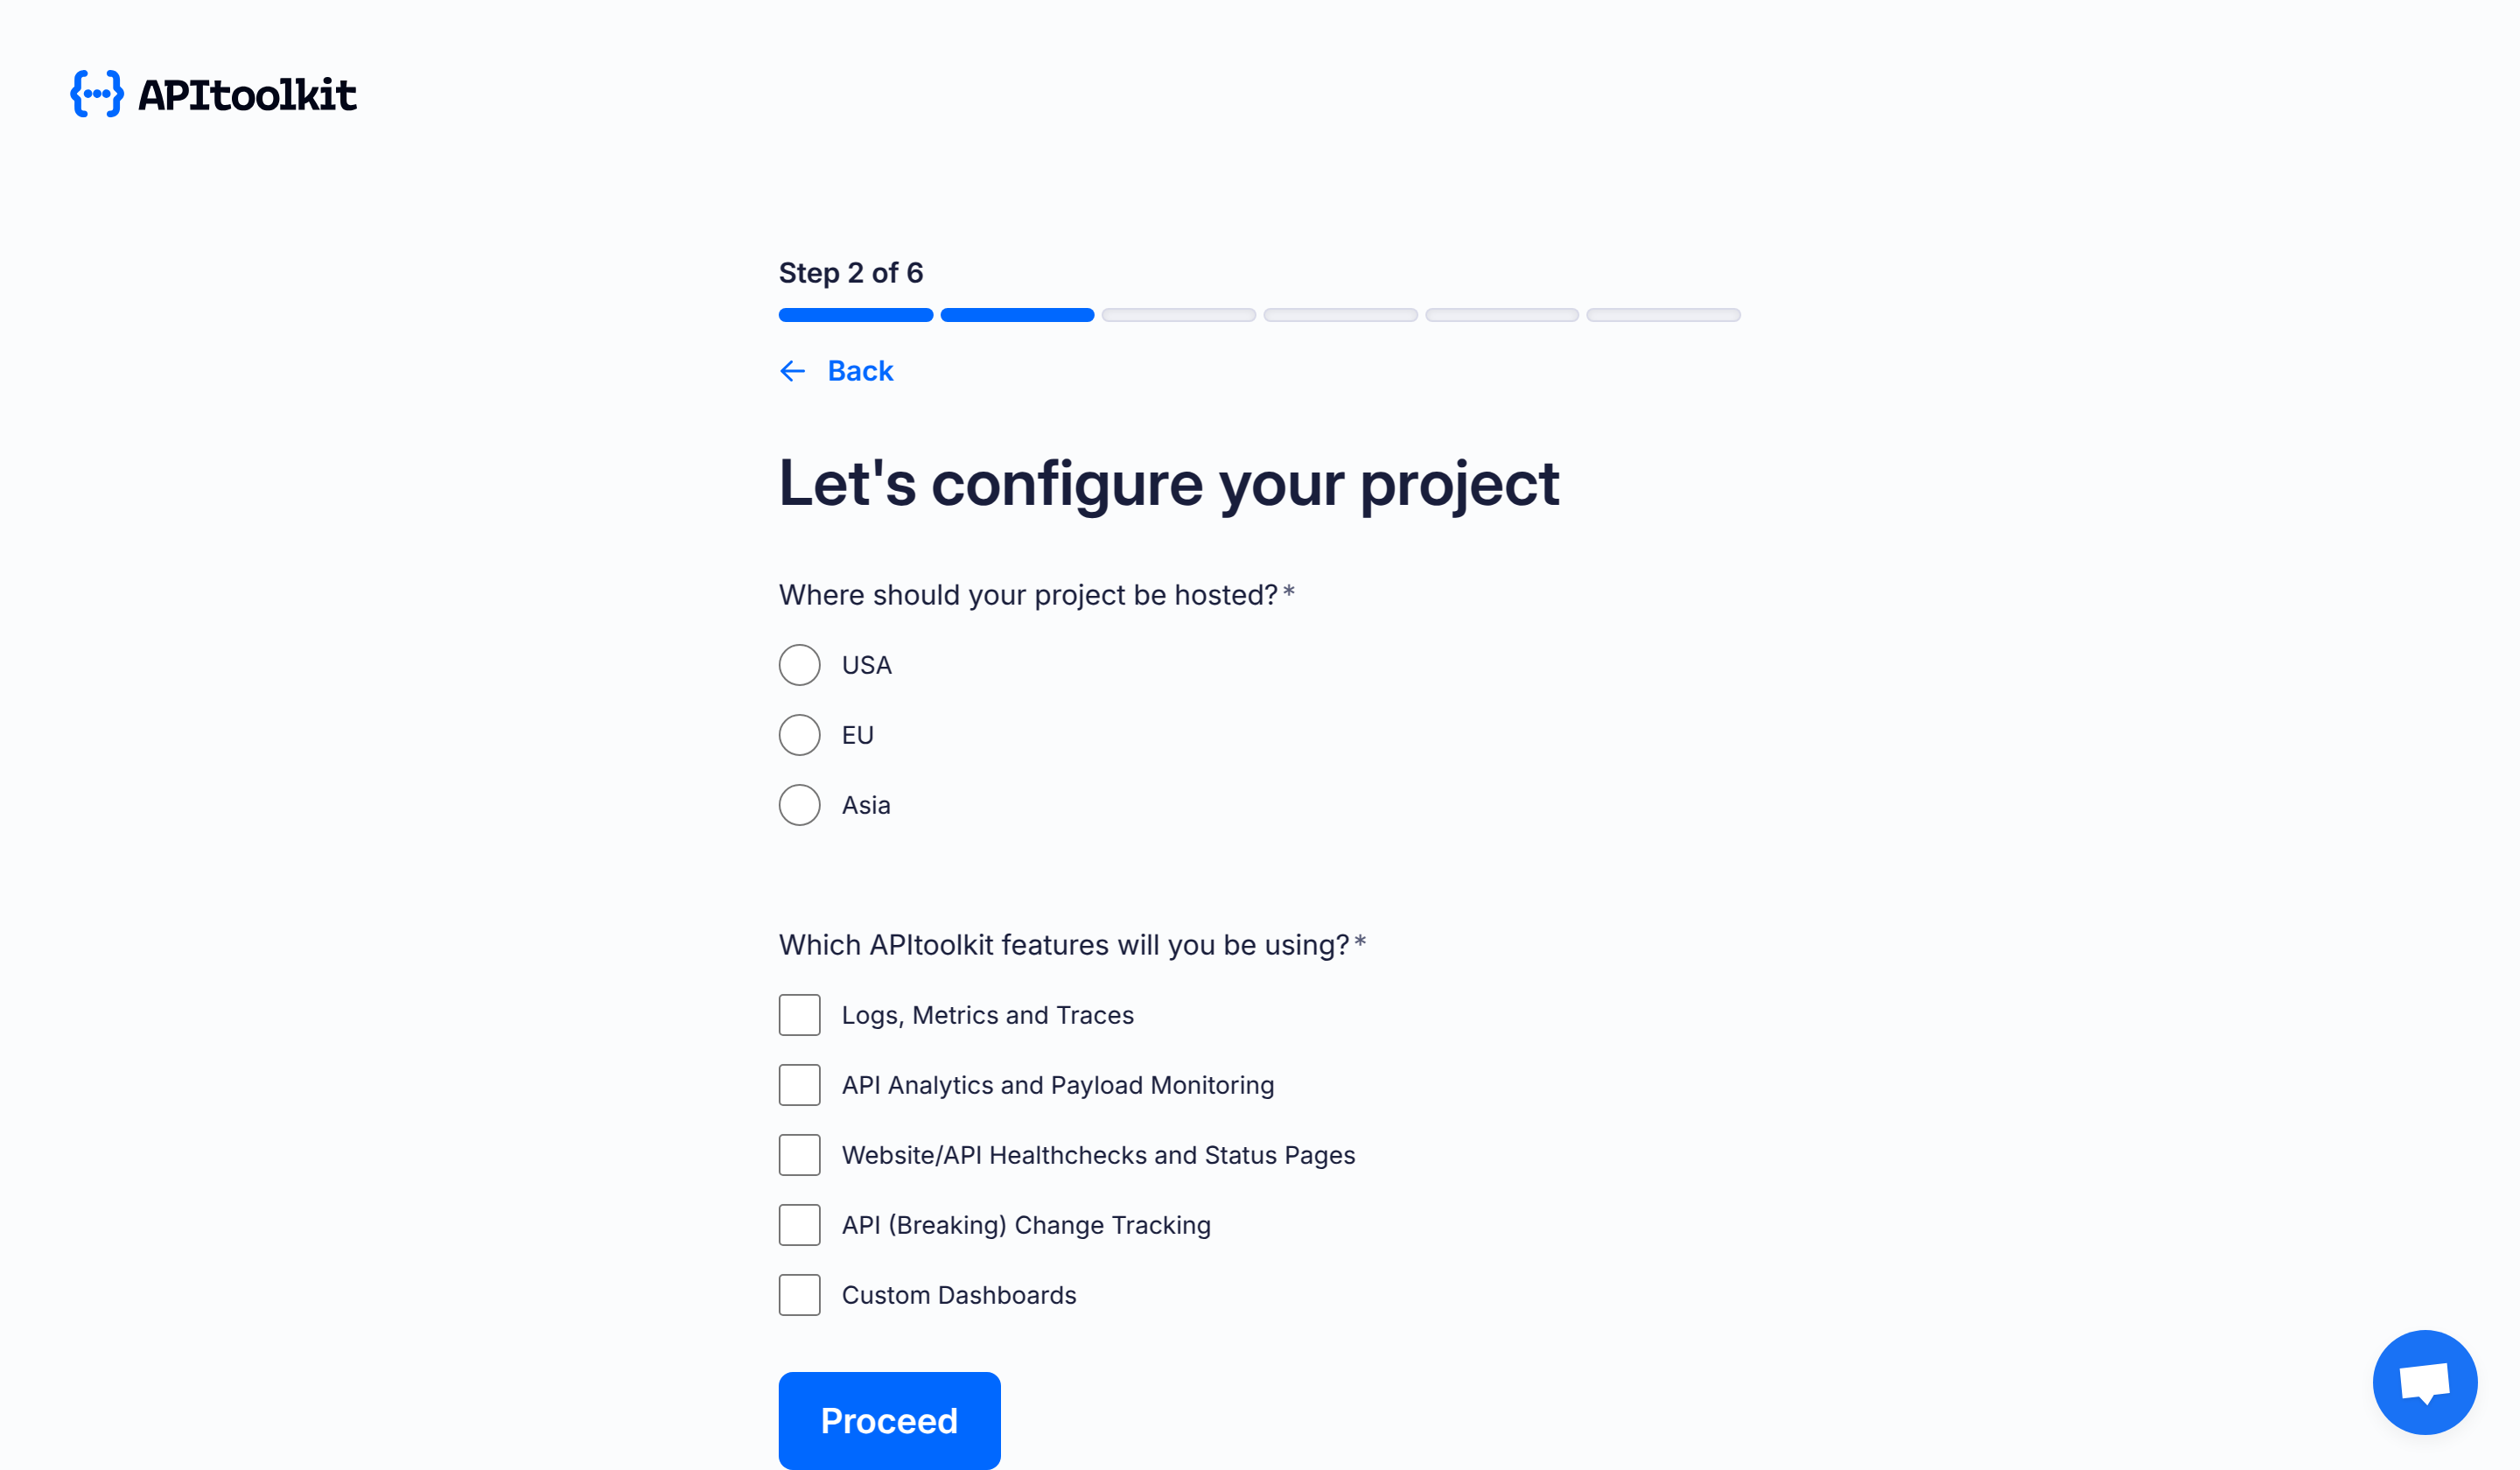
Setup project: Choose a server location and the features you’ll be exploring.
-
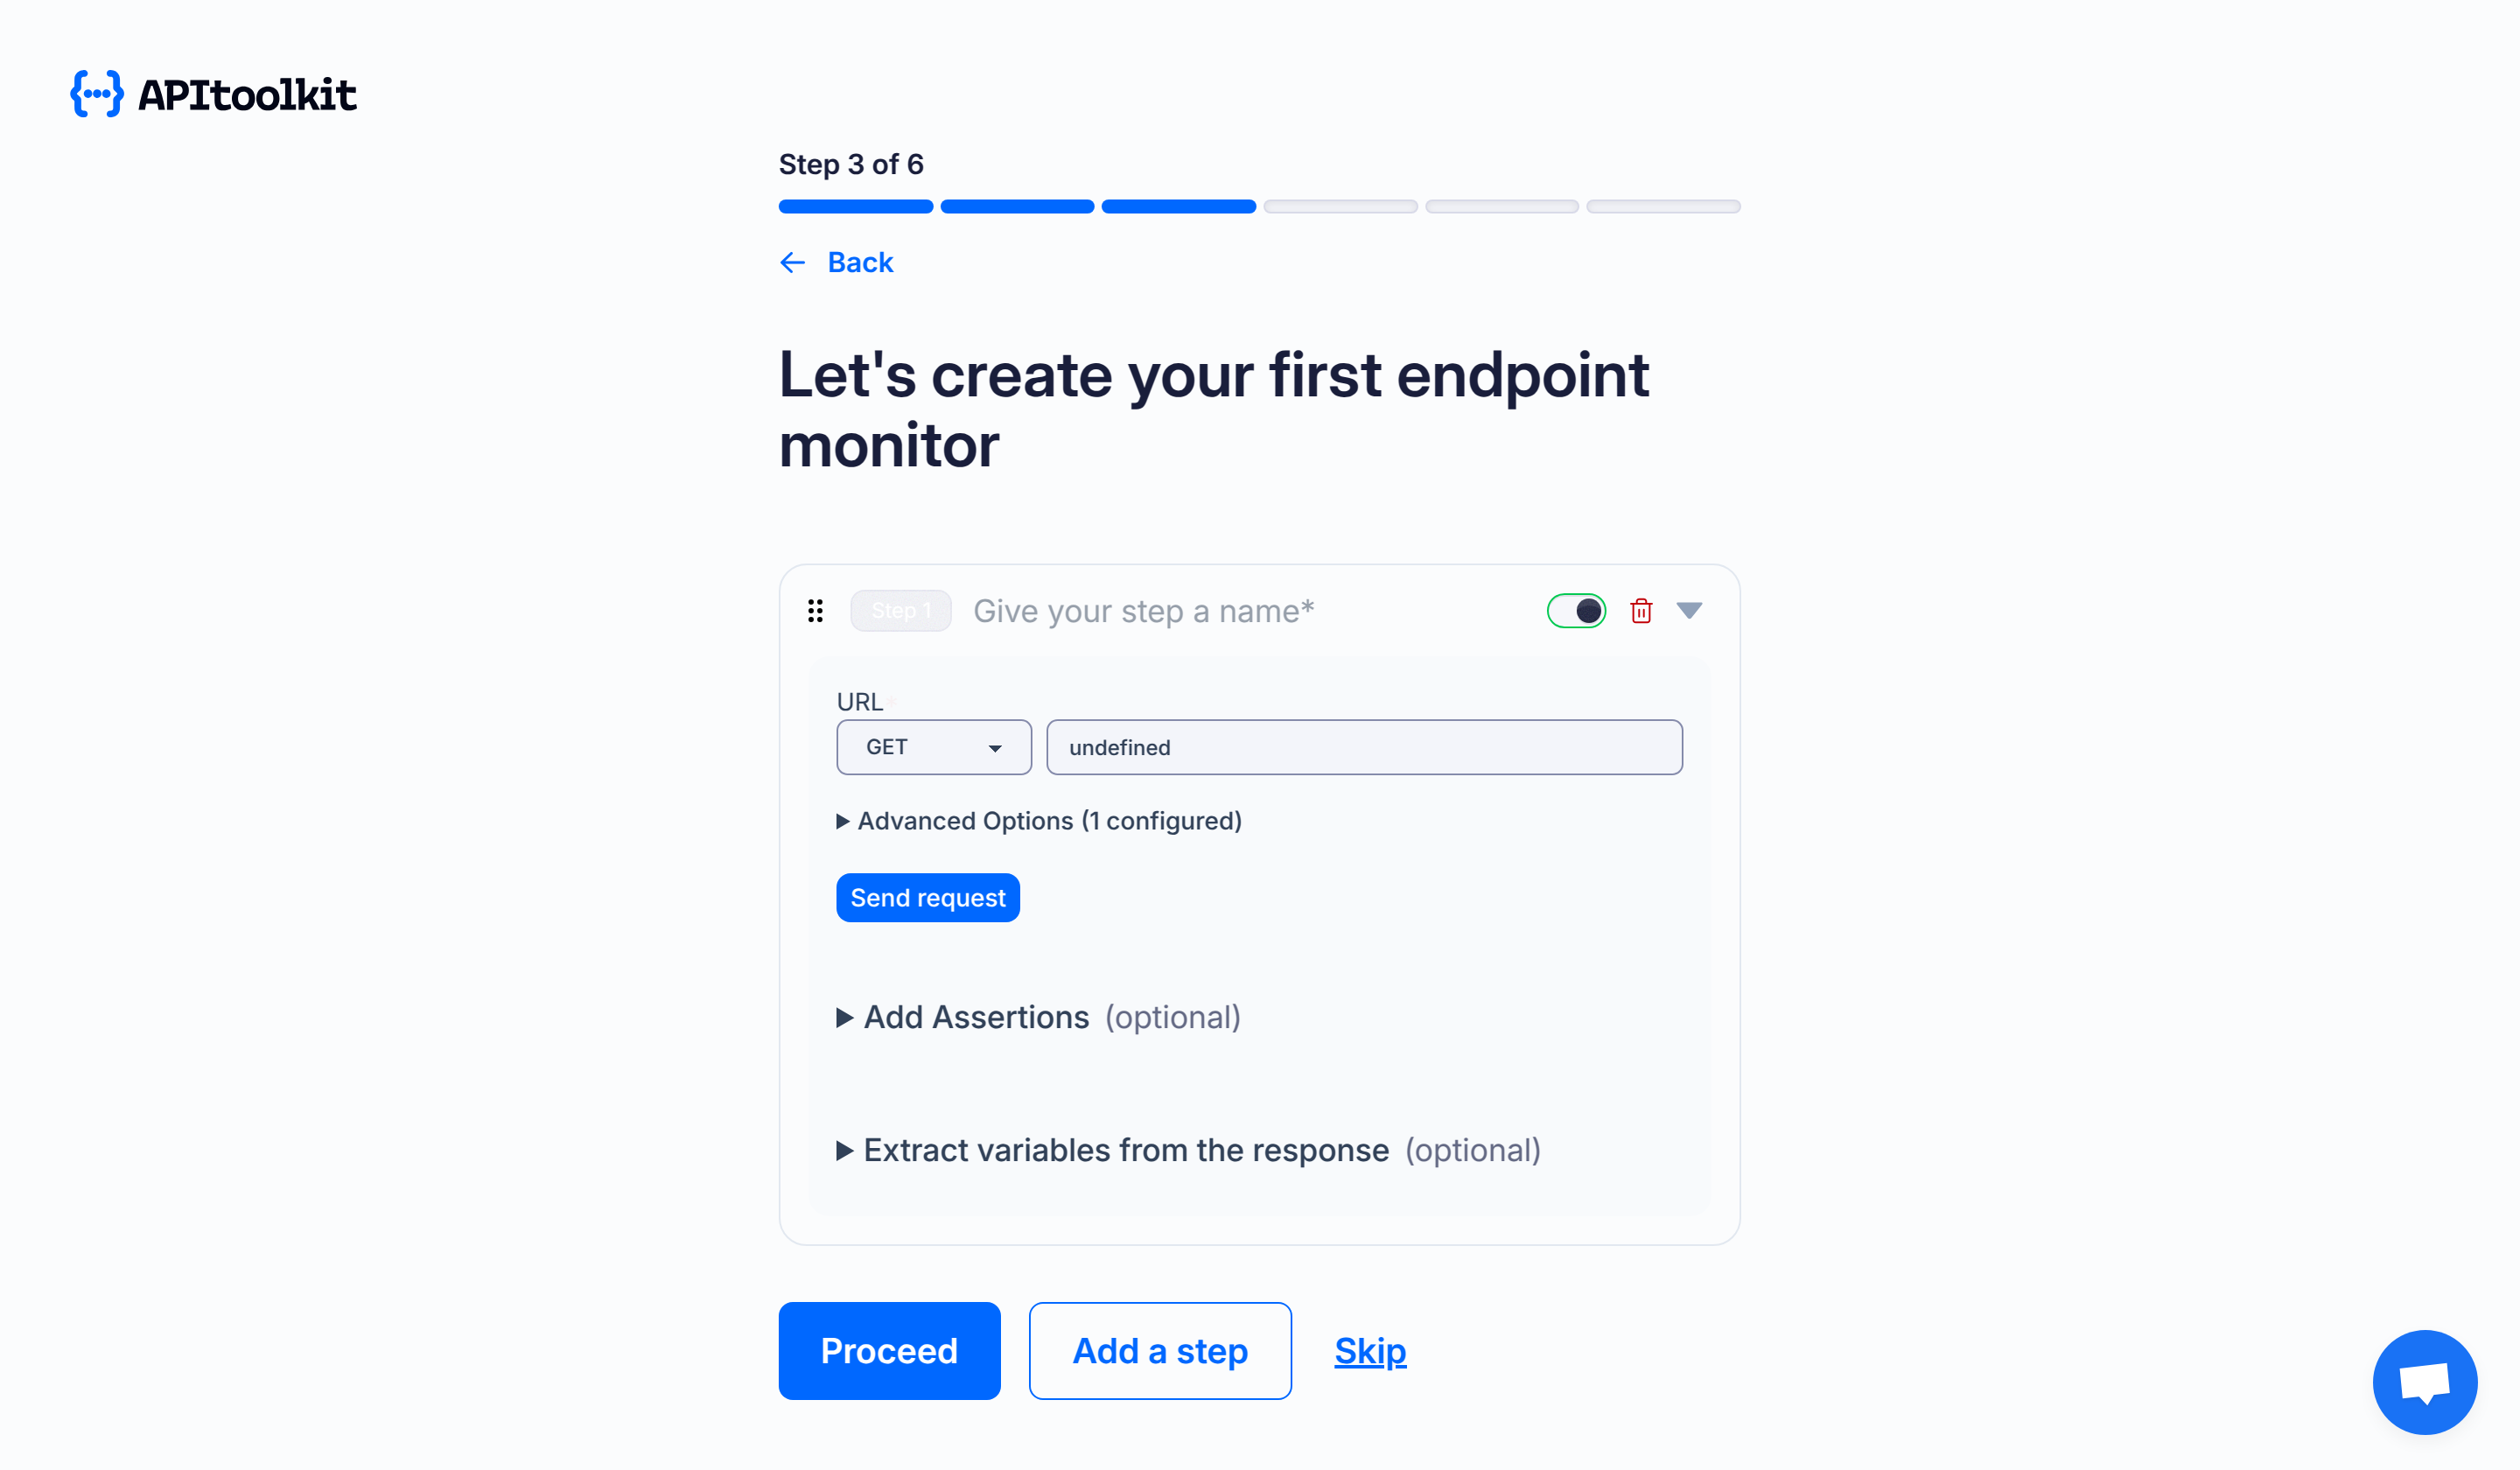
Create endpoint: Add an endpoint to monitor and optionally choose the request type.
-
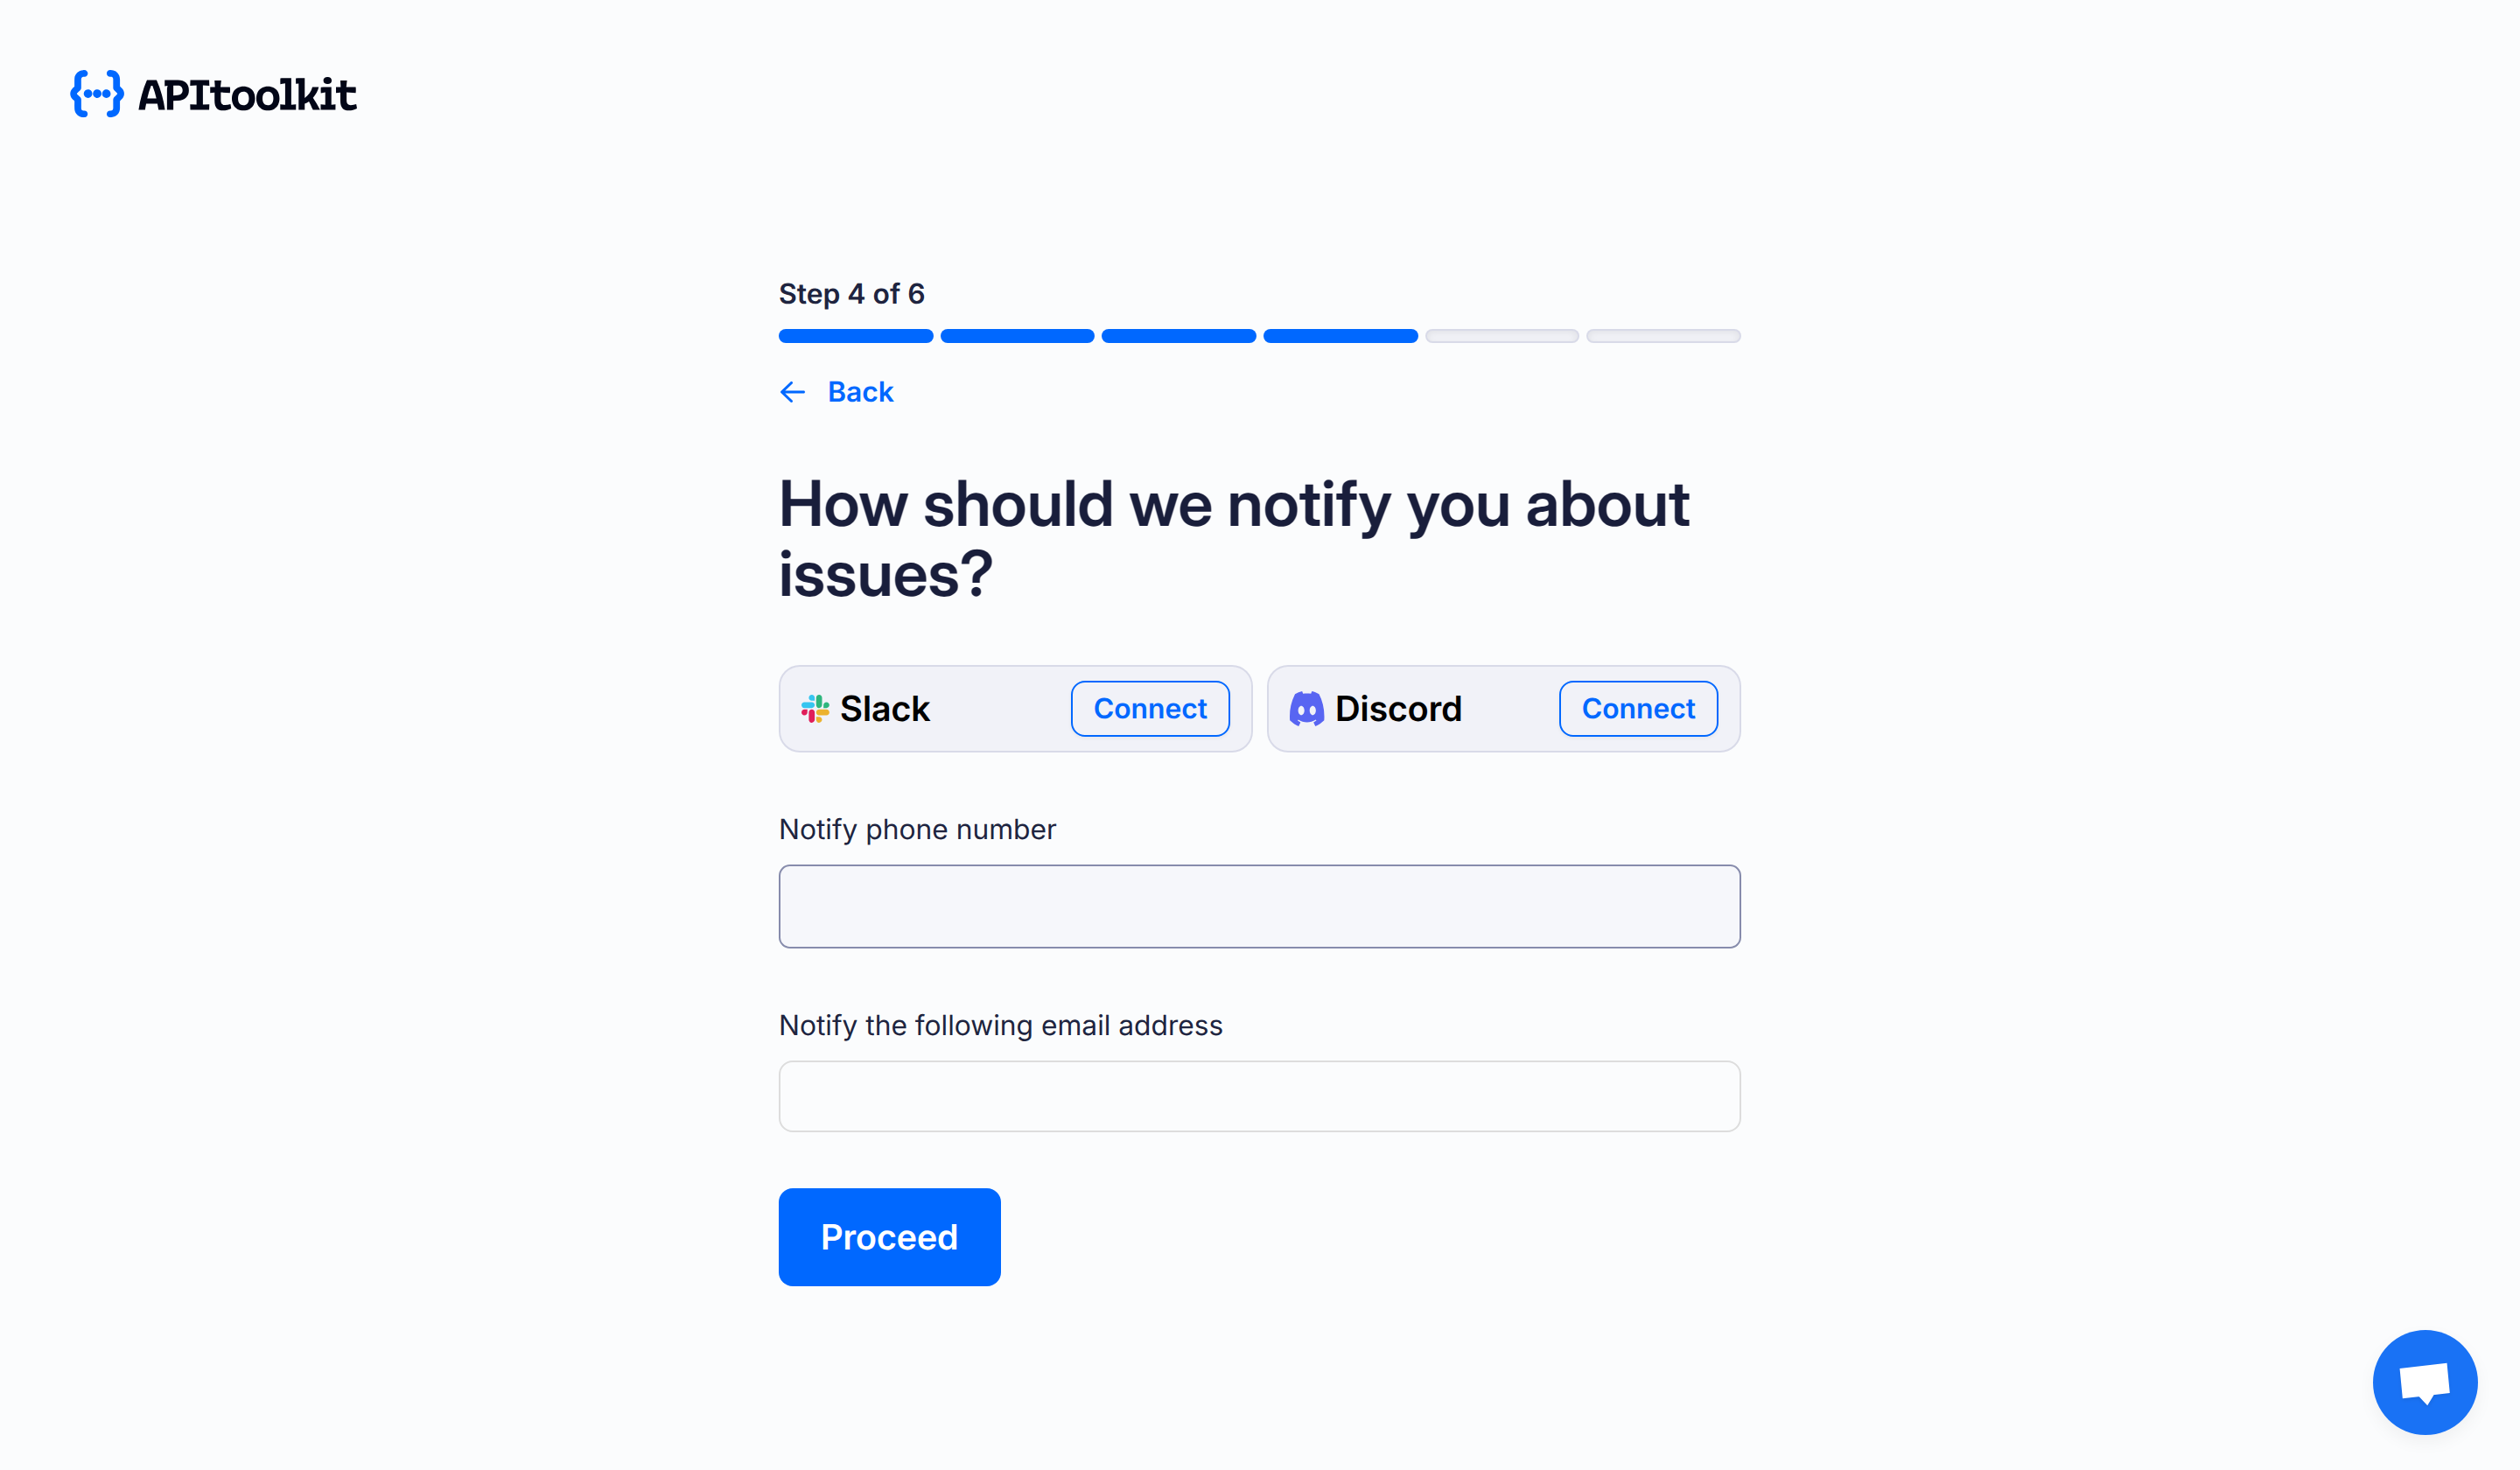
Set notifications: Get alerts via Slack, Discord, email, or SMS when something goes wrong (optional).
-
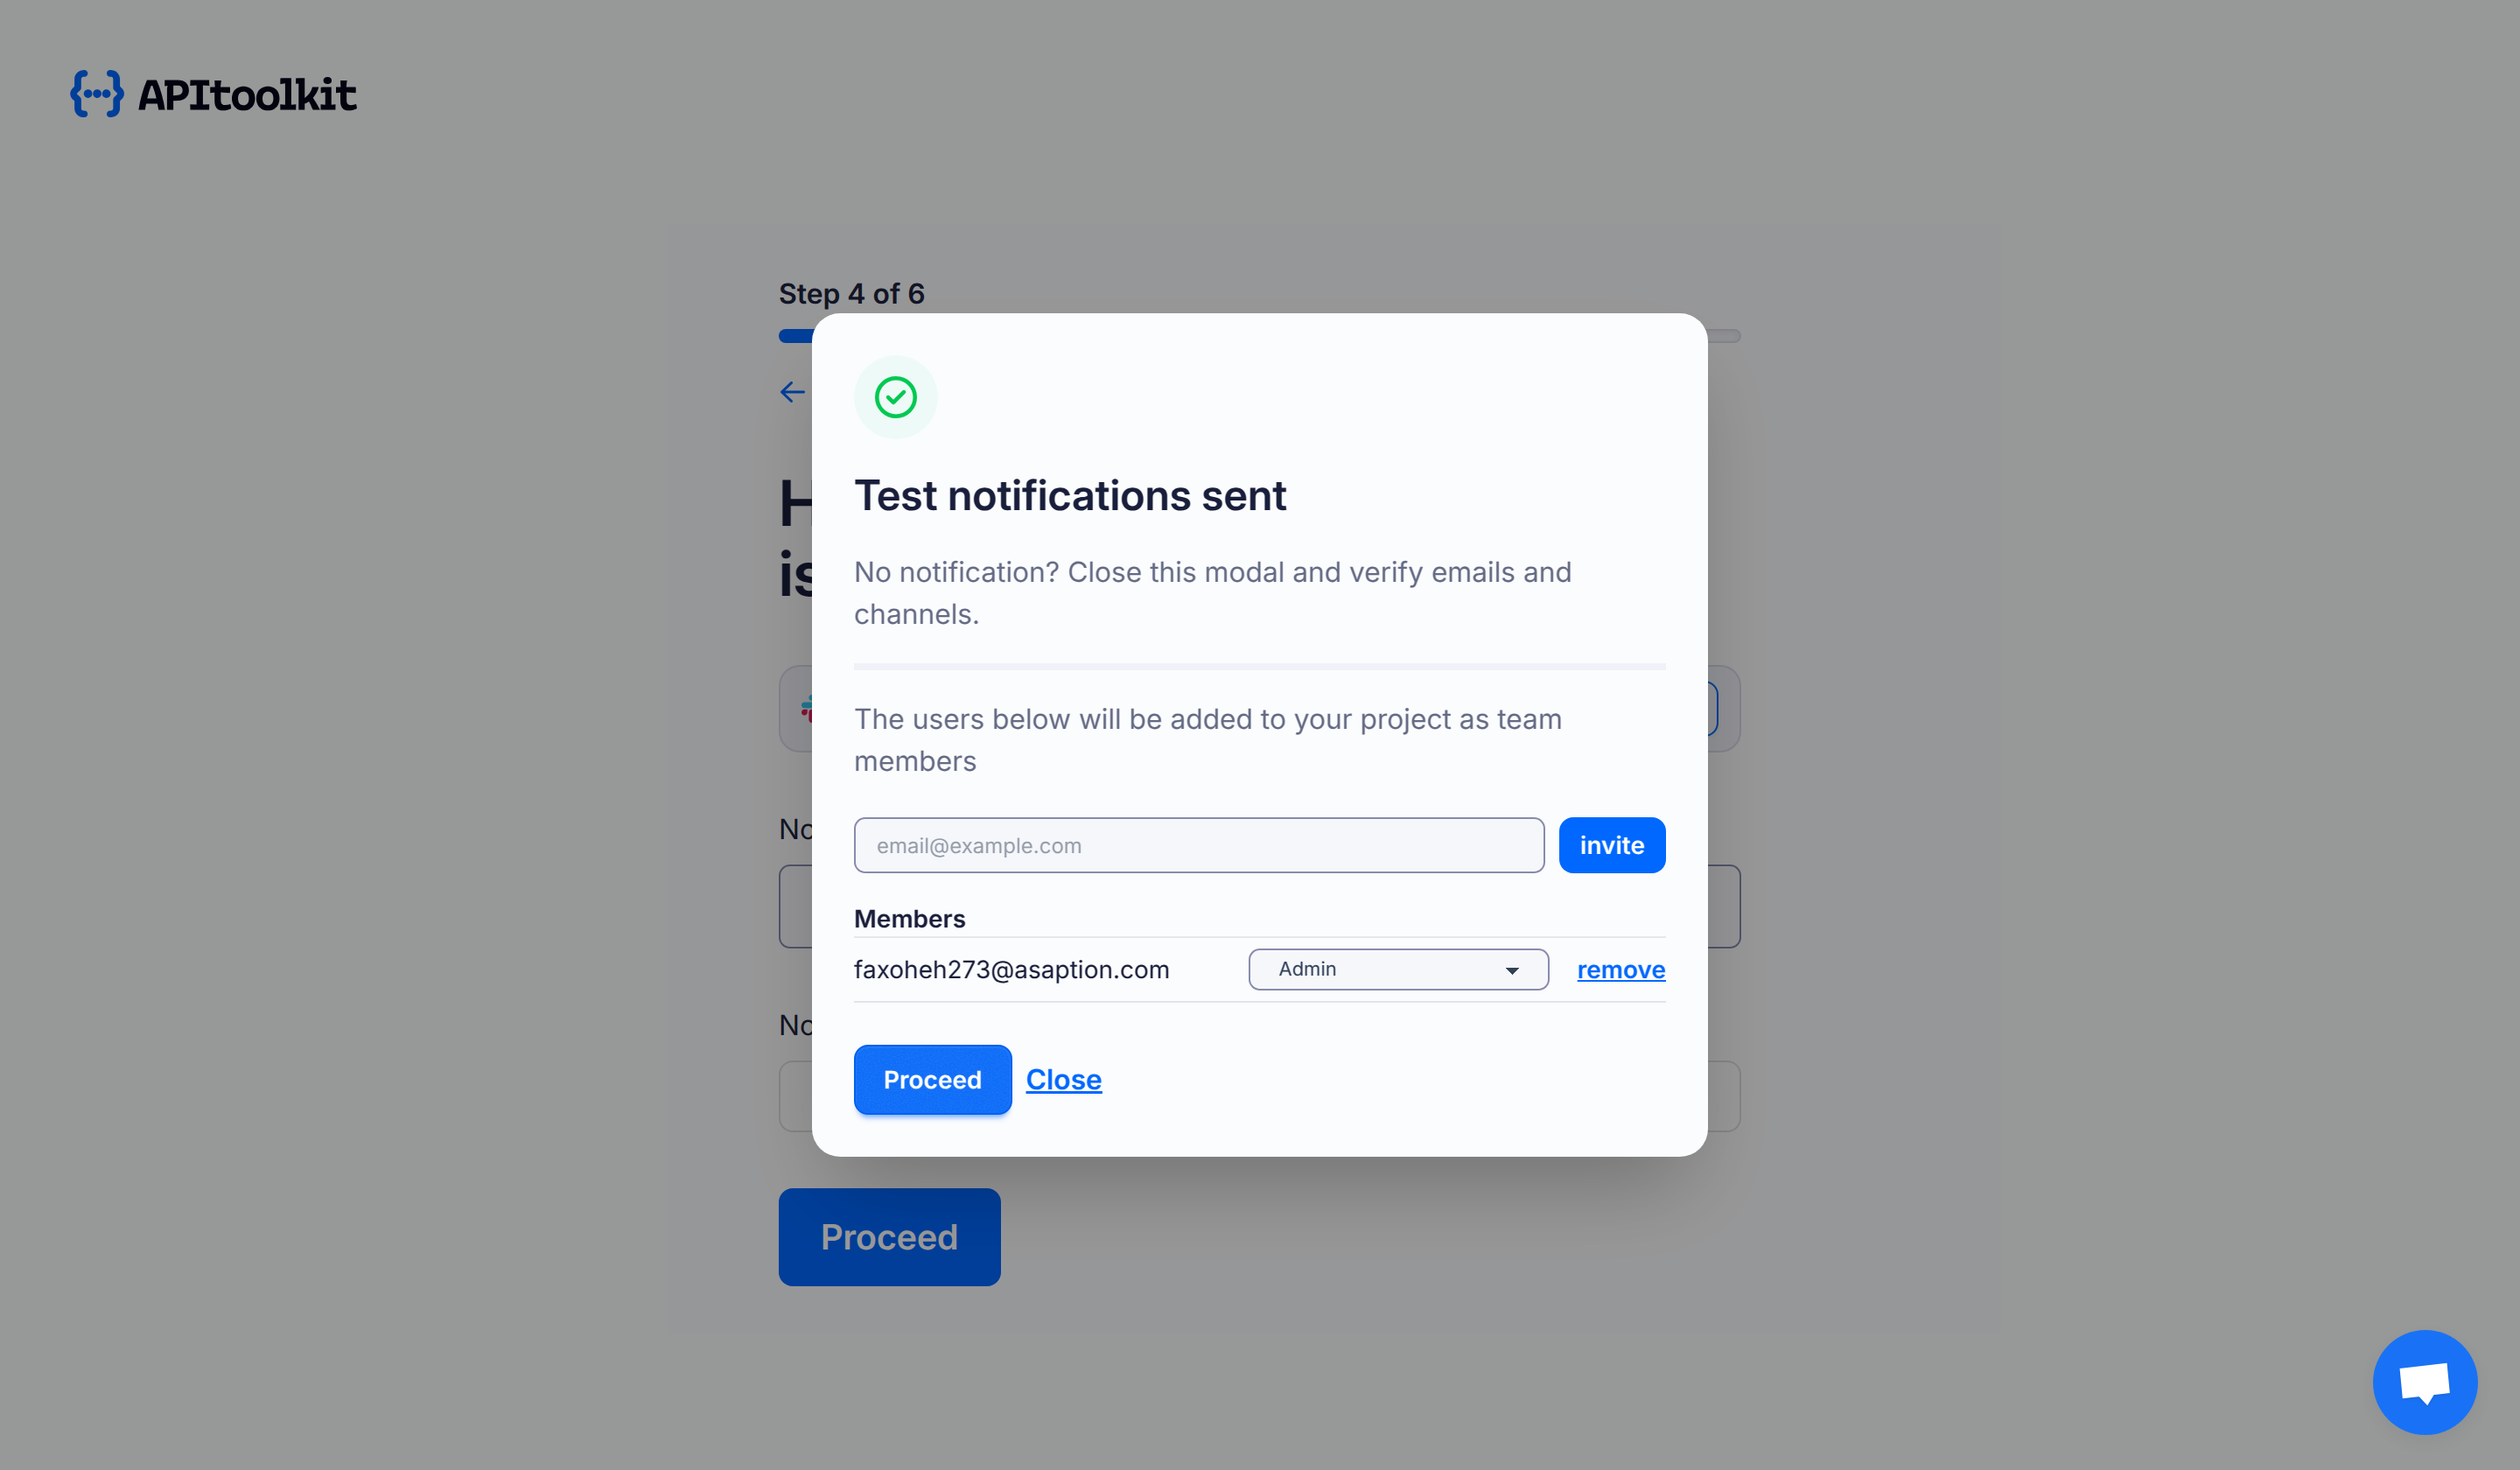
Add member: Invite teammates to the project (optional).
-
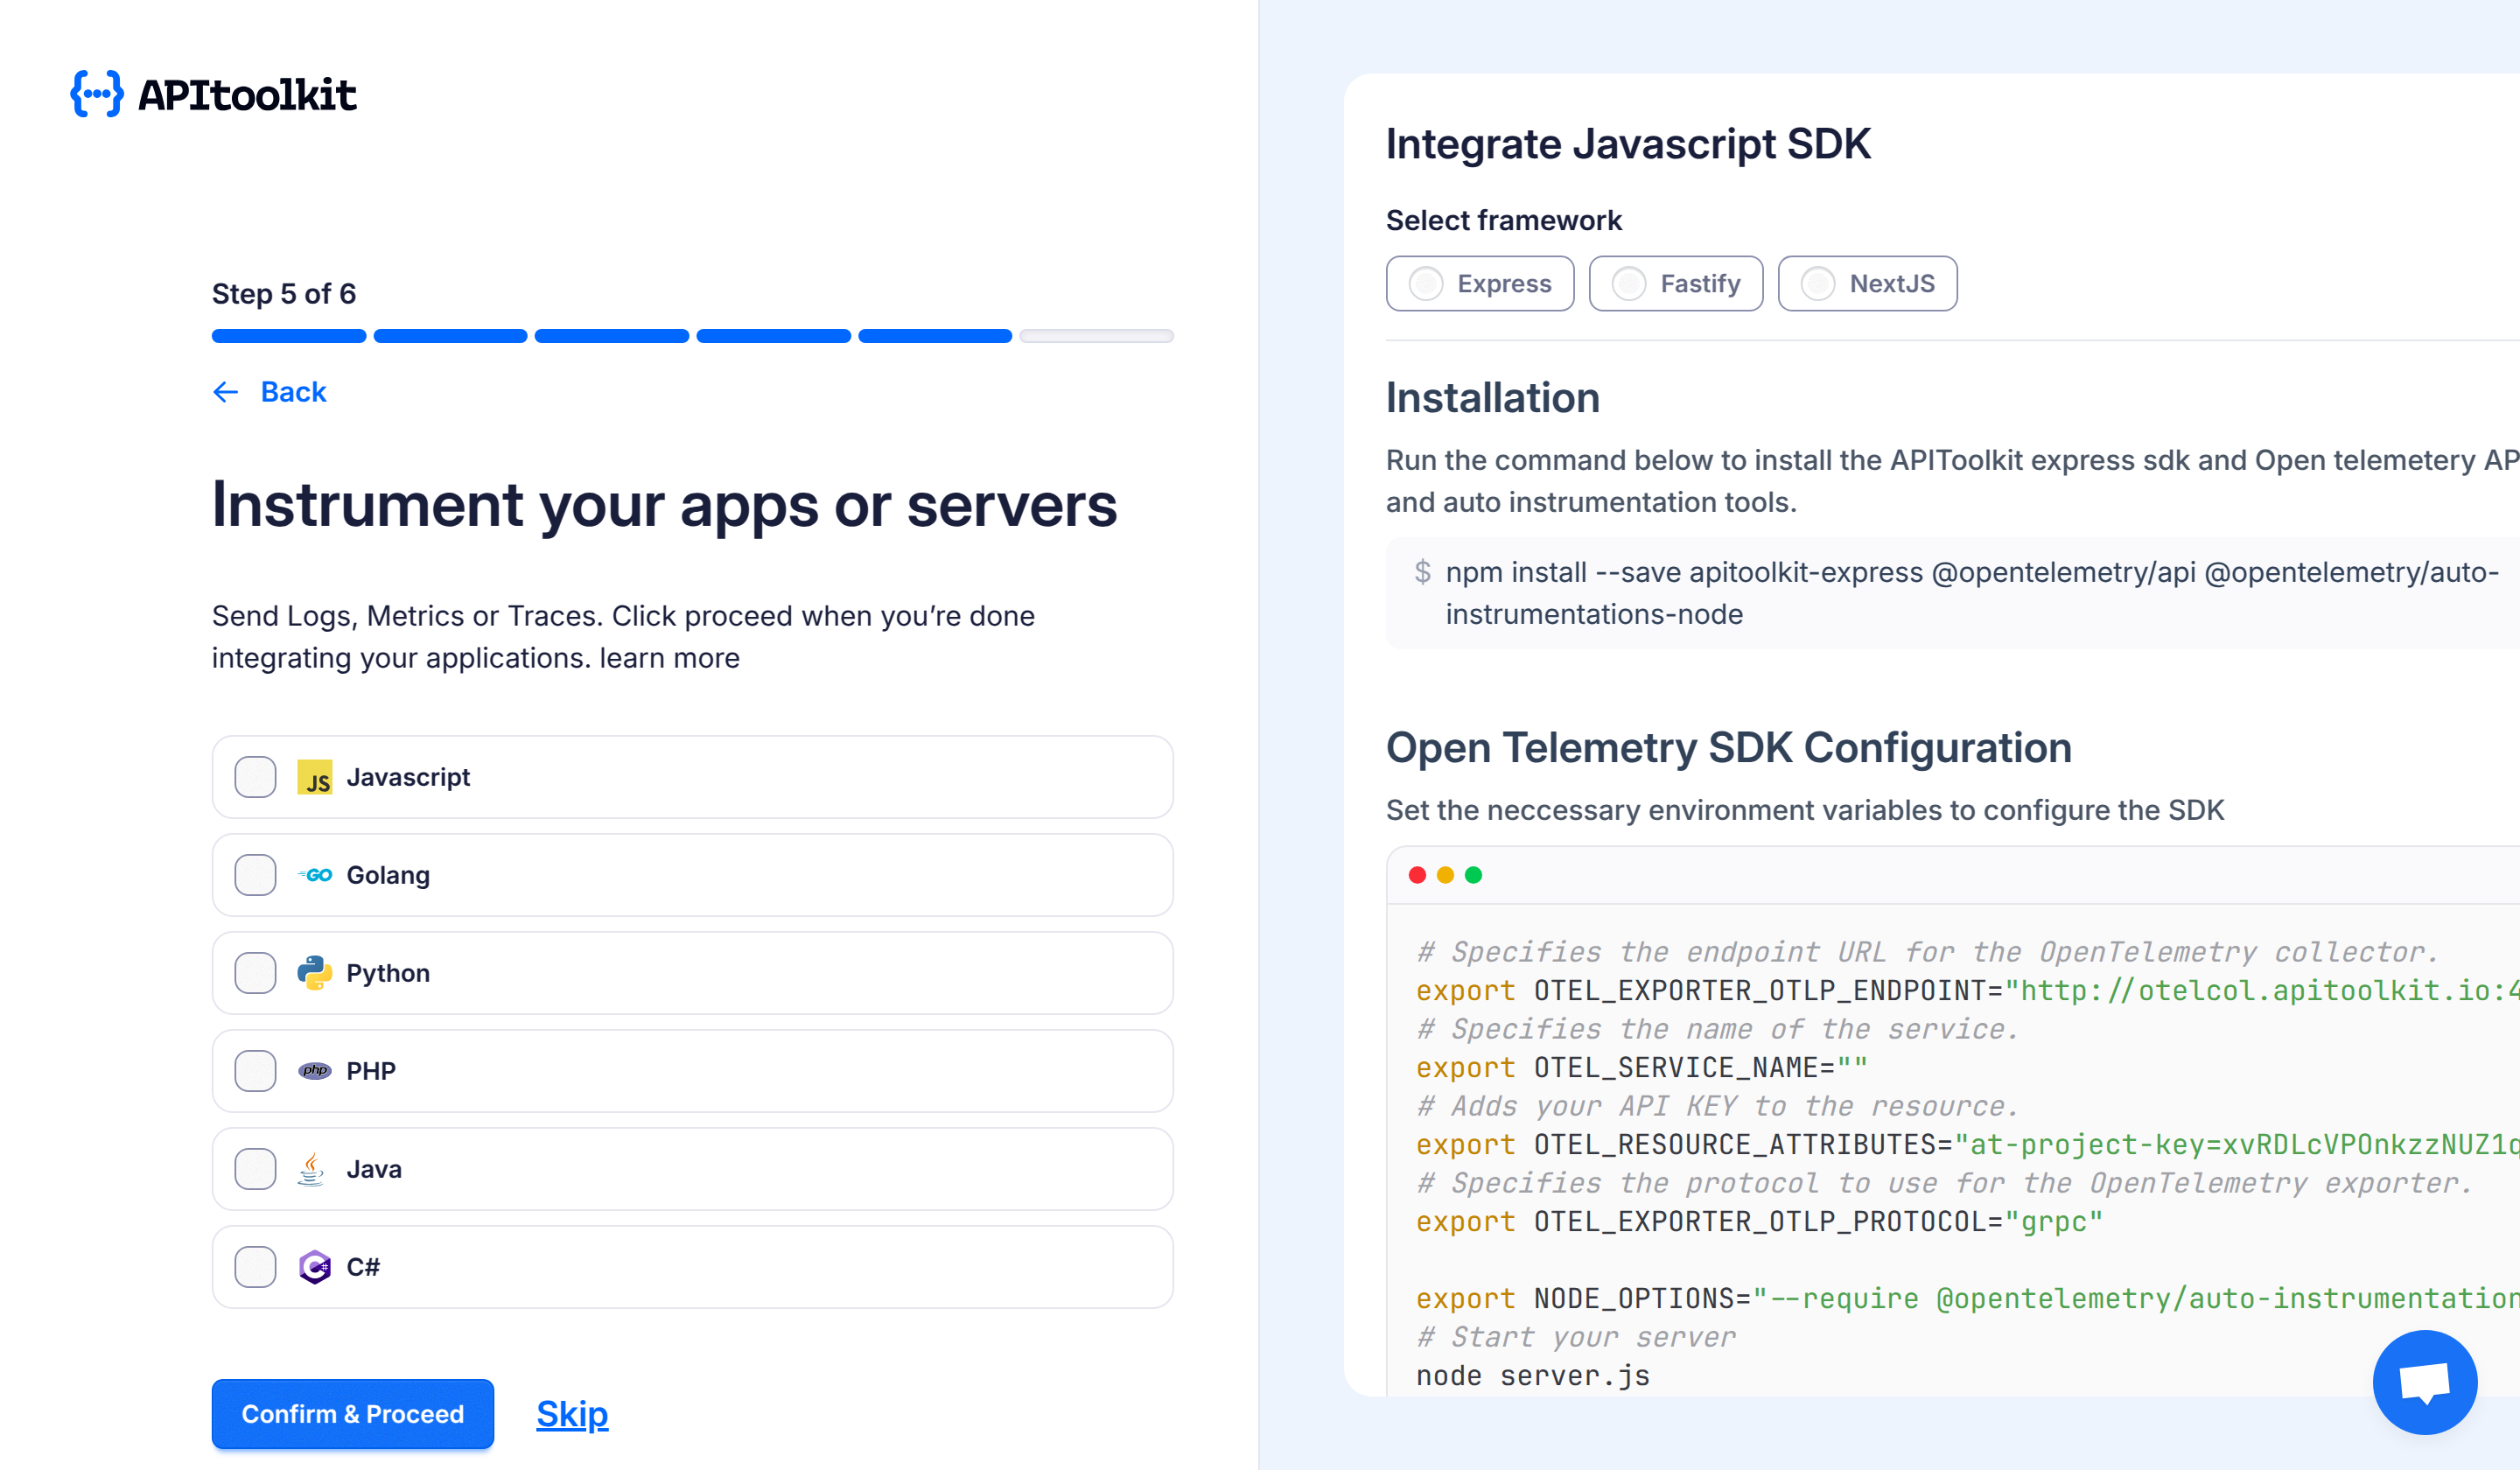
Integration examples: See sample code for your framework (optional).
-
Plan: Choose your billing plan (required).
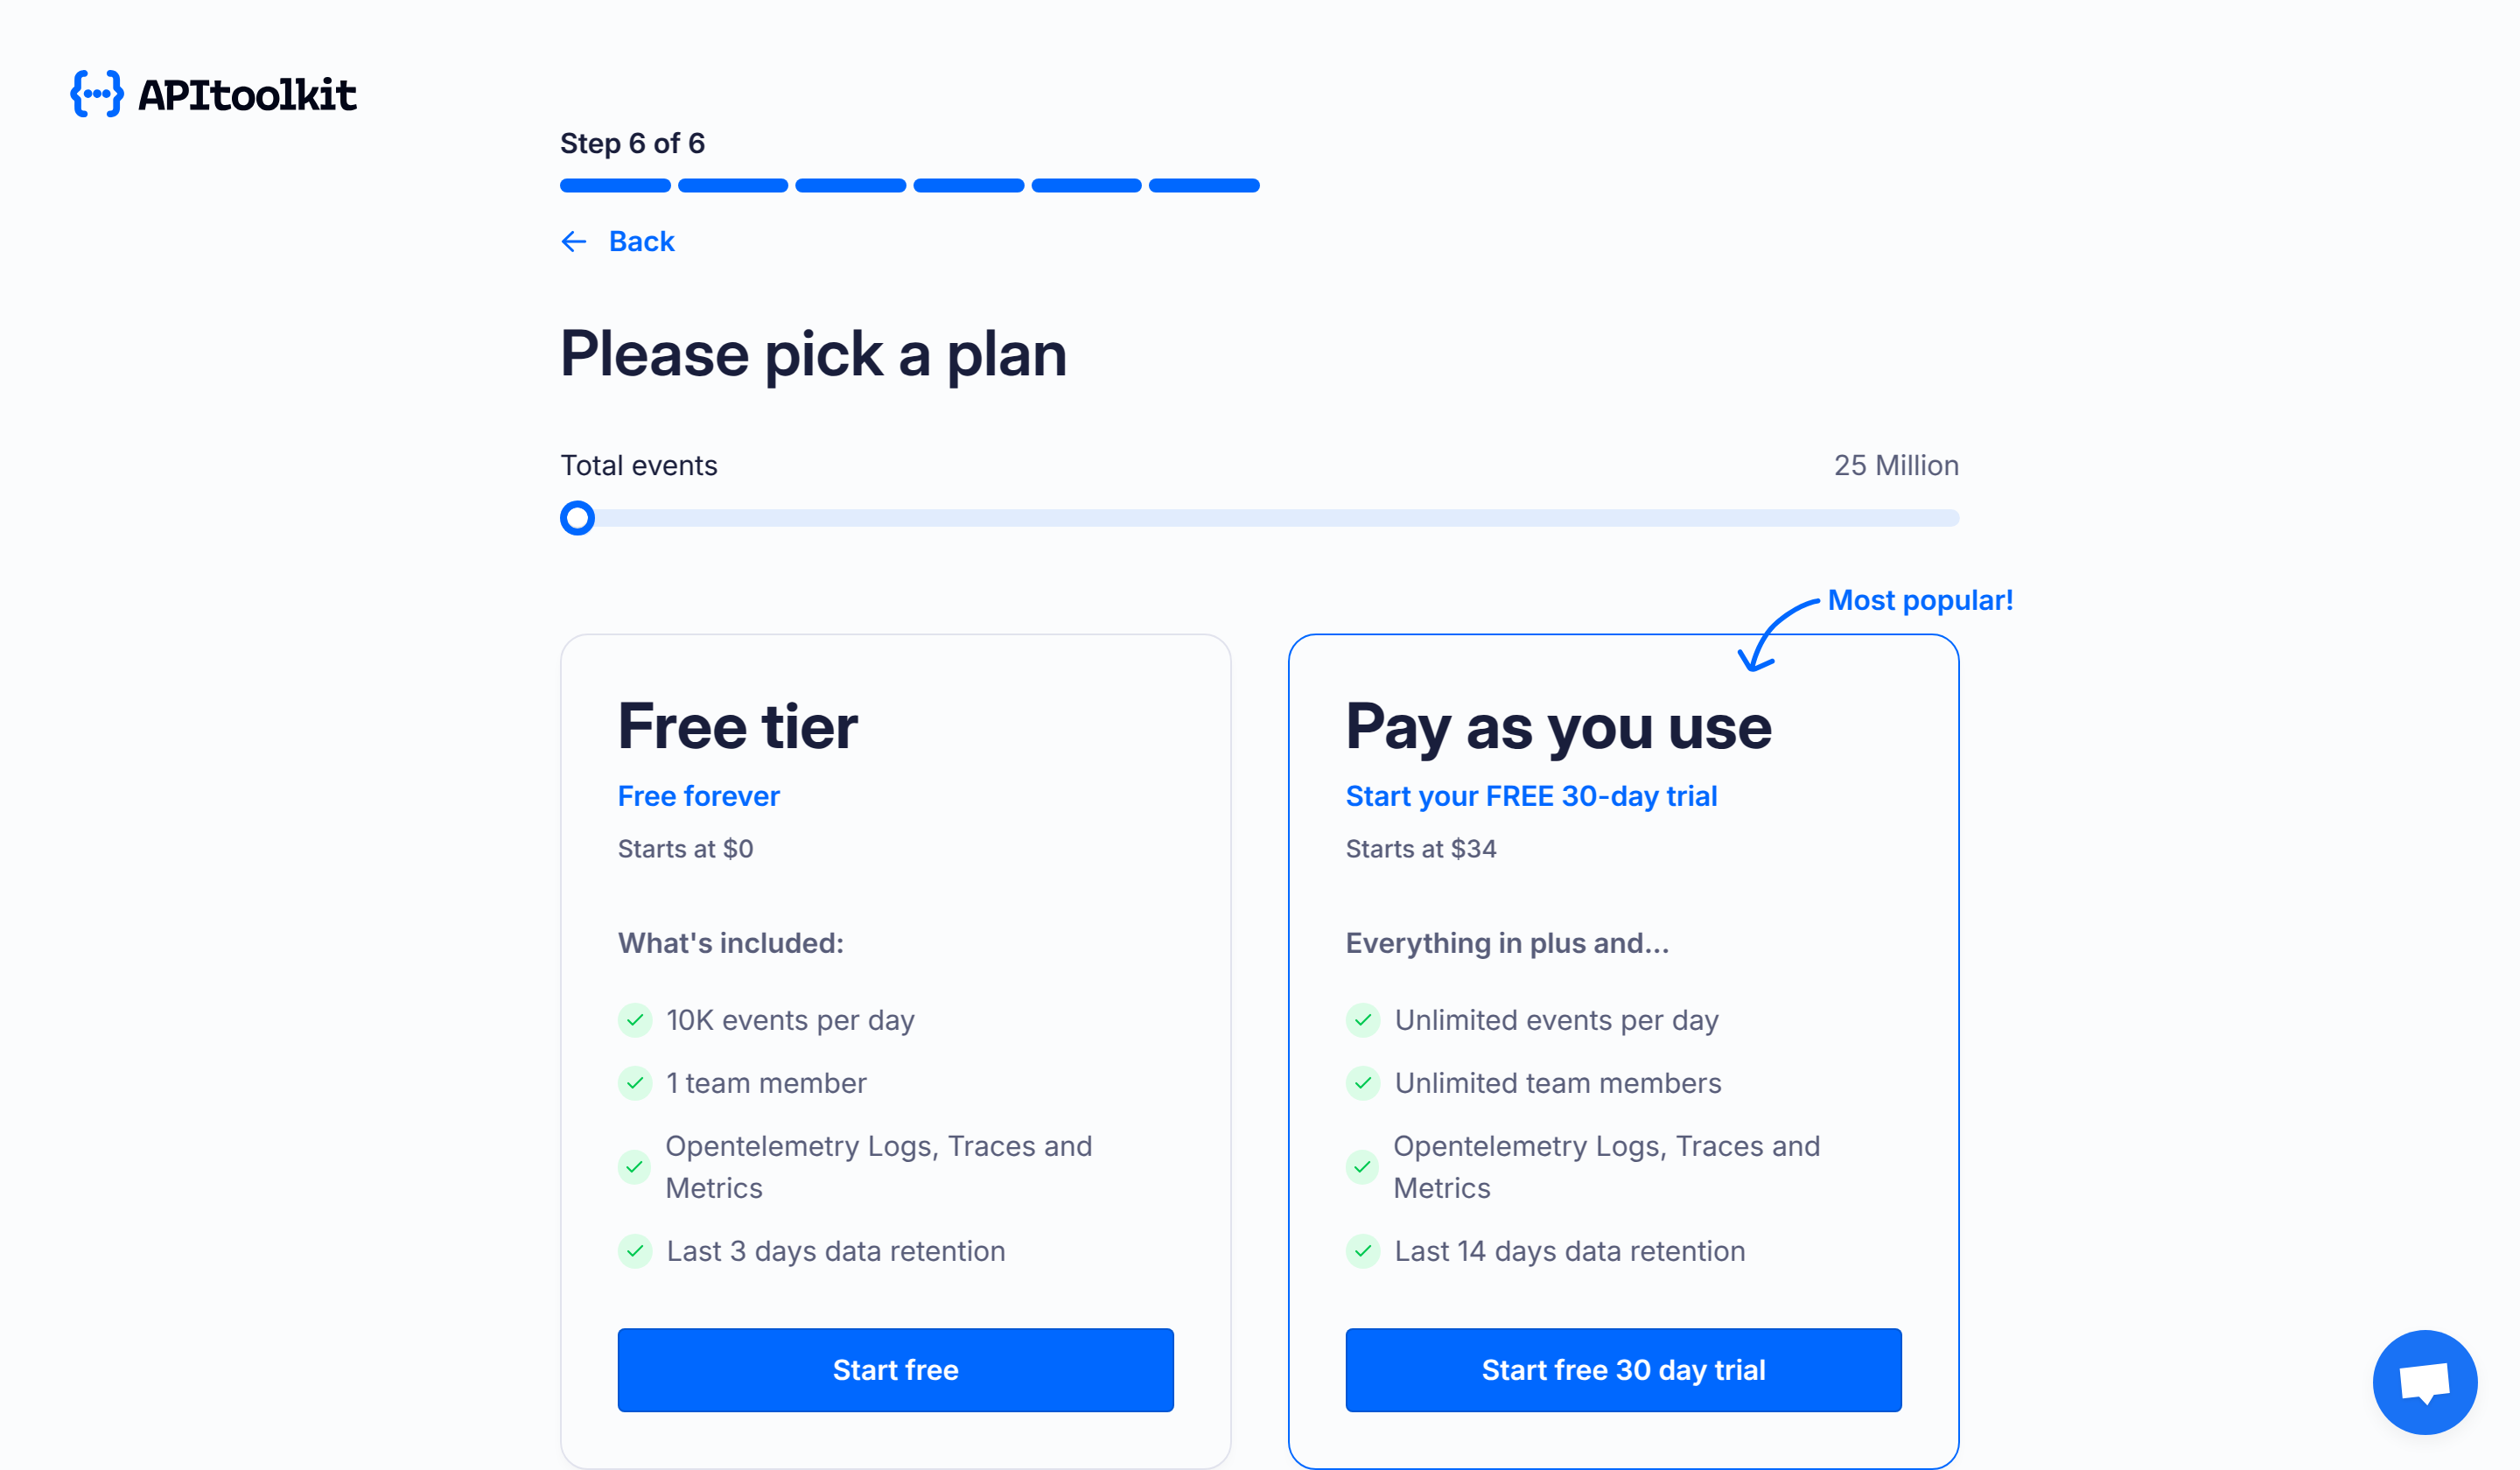
Click Proceed to create your project. You'll be taken to the dashboard.
③ Get Your API Key
An API key is generated automatically when you create a project. To find it or create additional keys, click API Keys in the bottom-left of the dashboard.
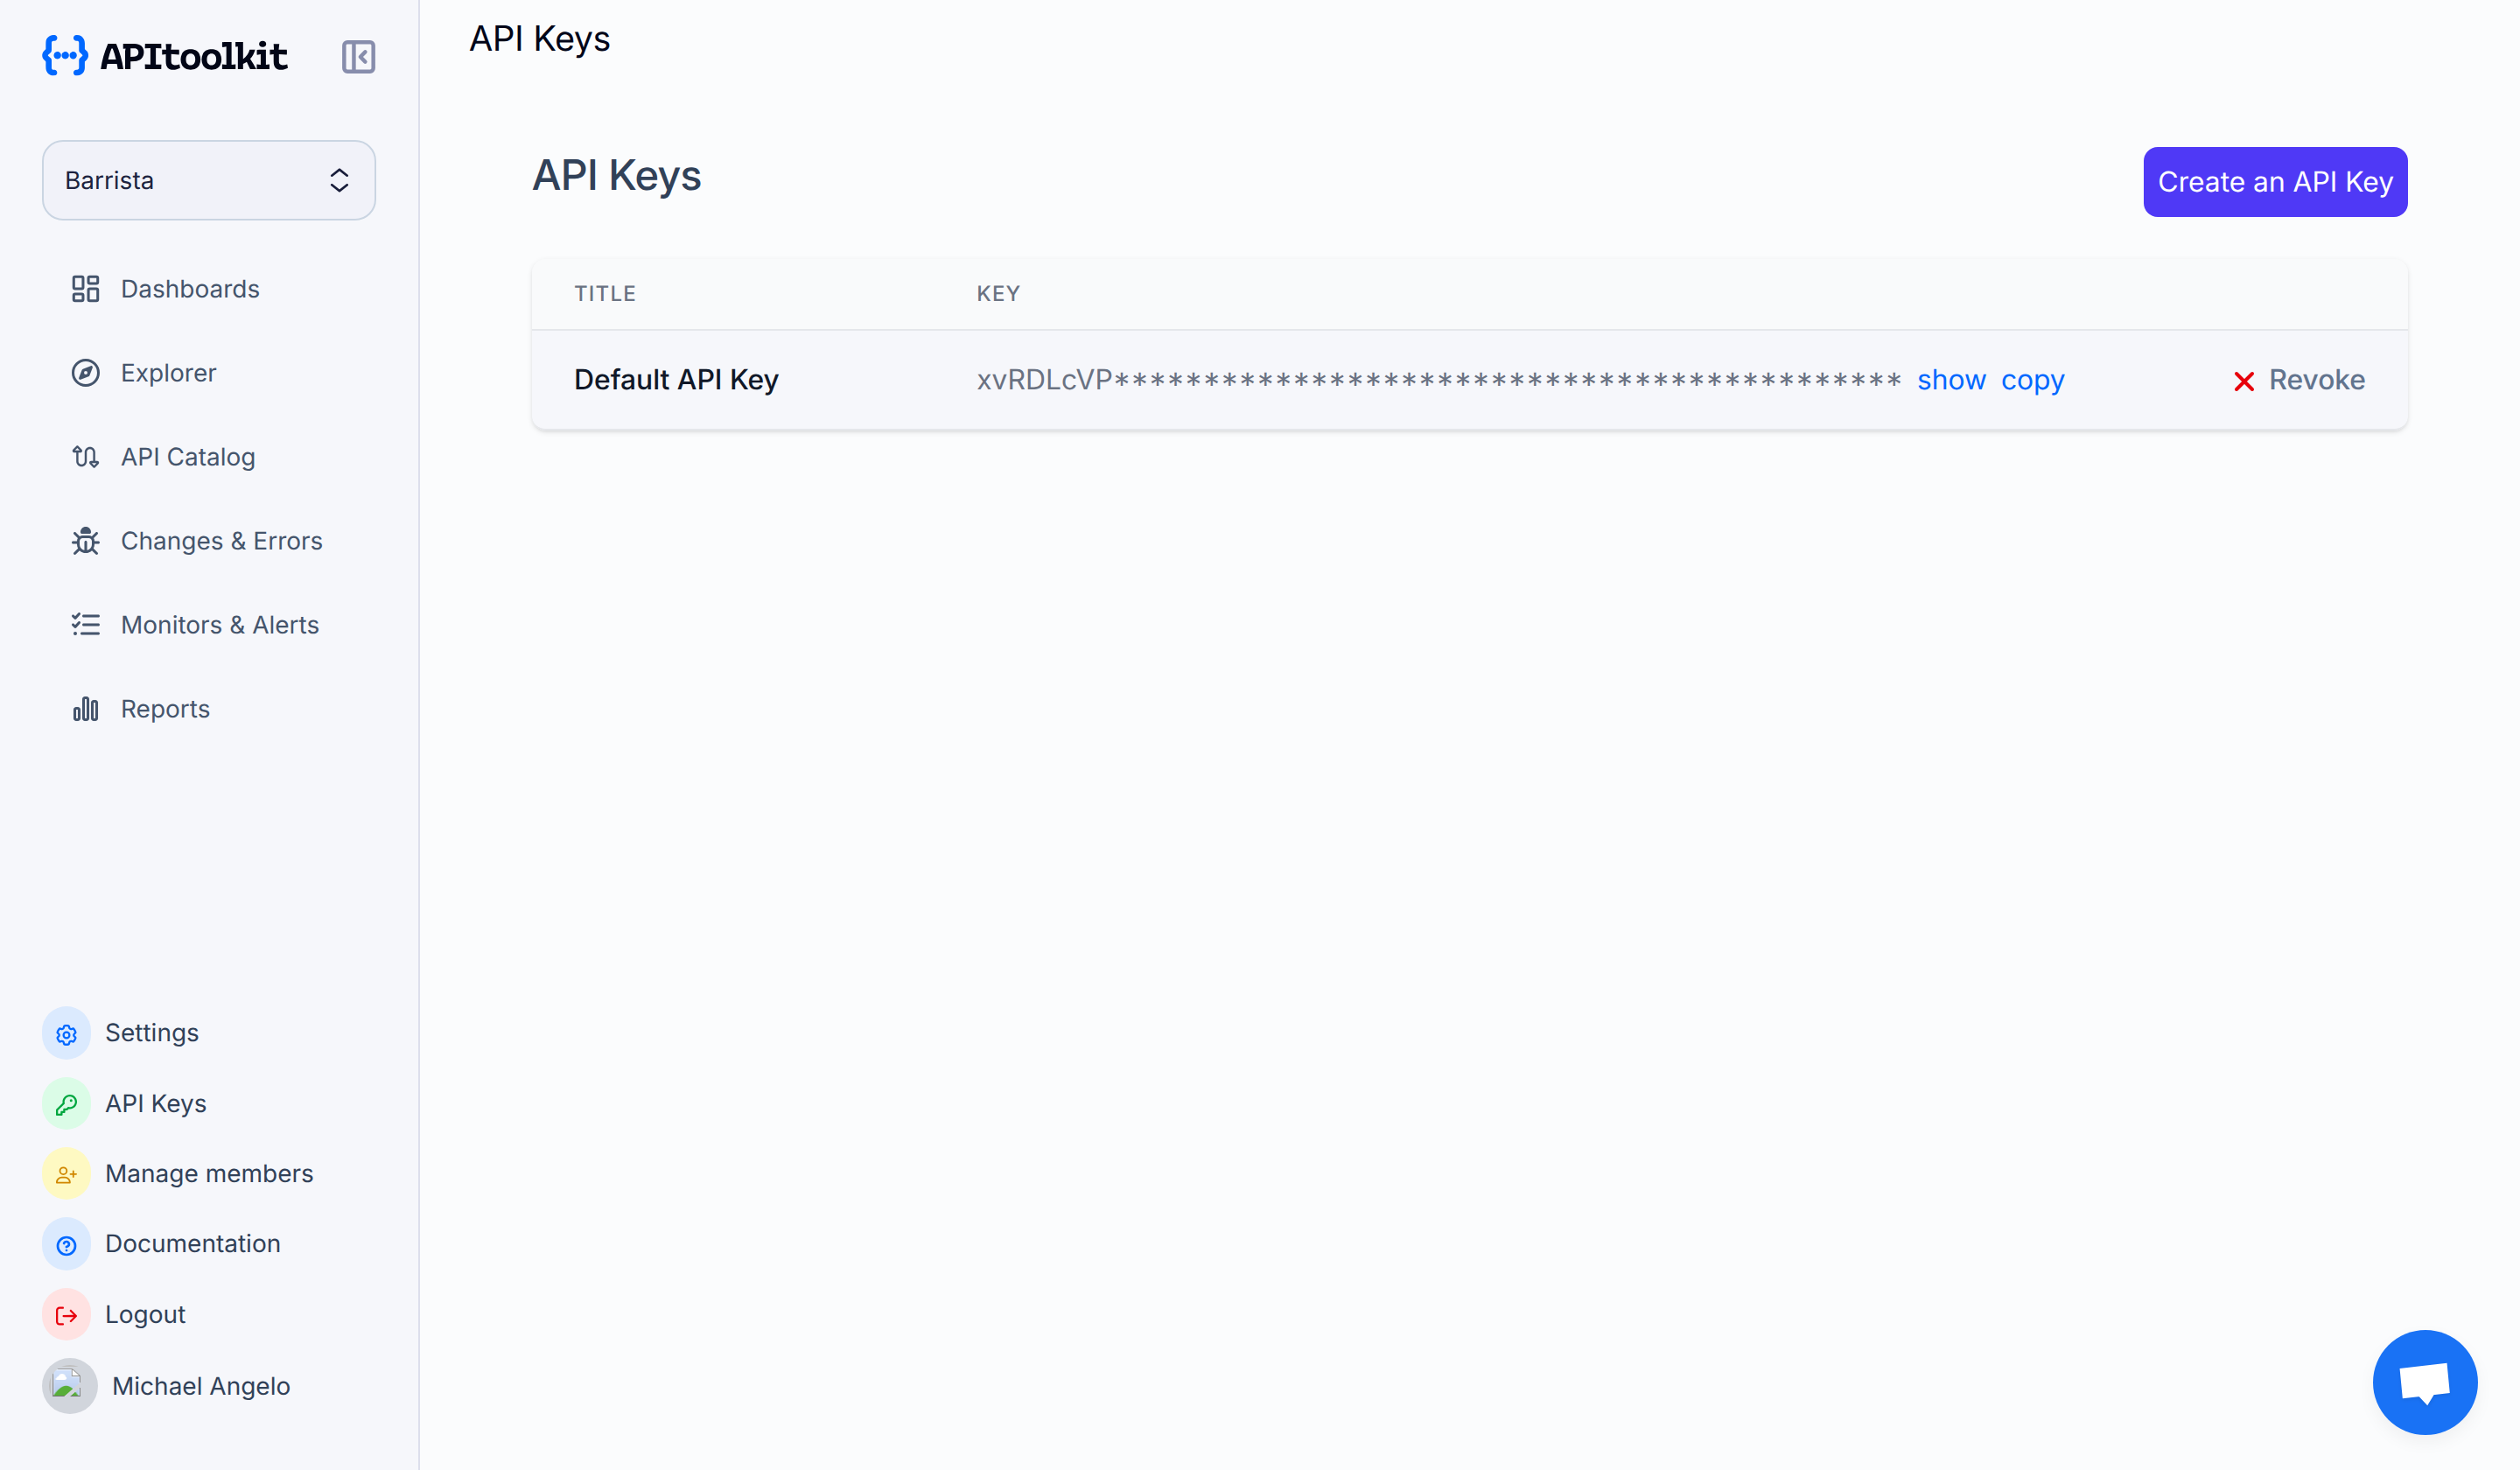
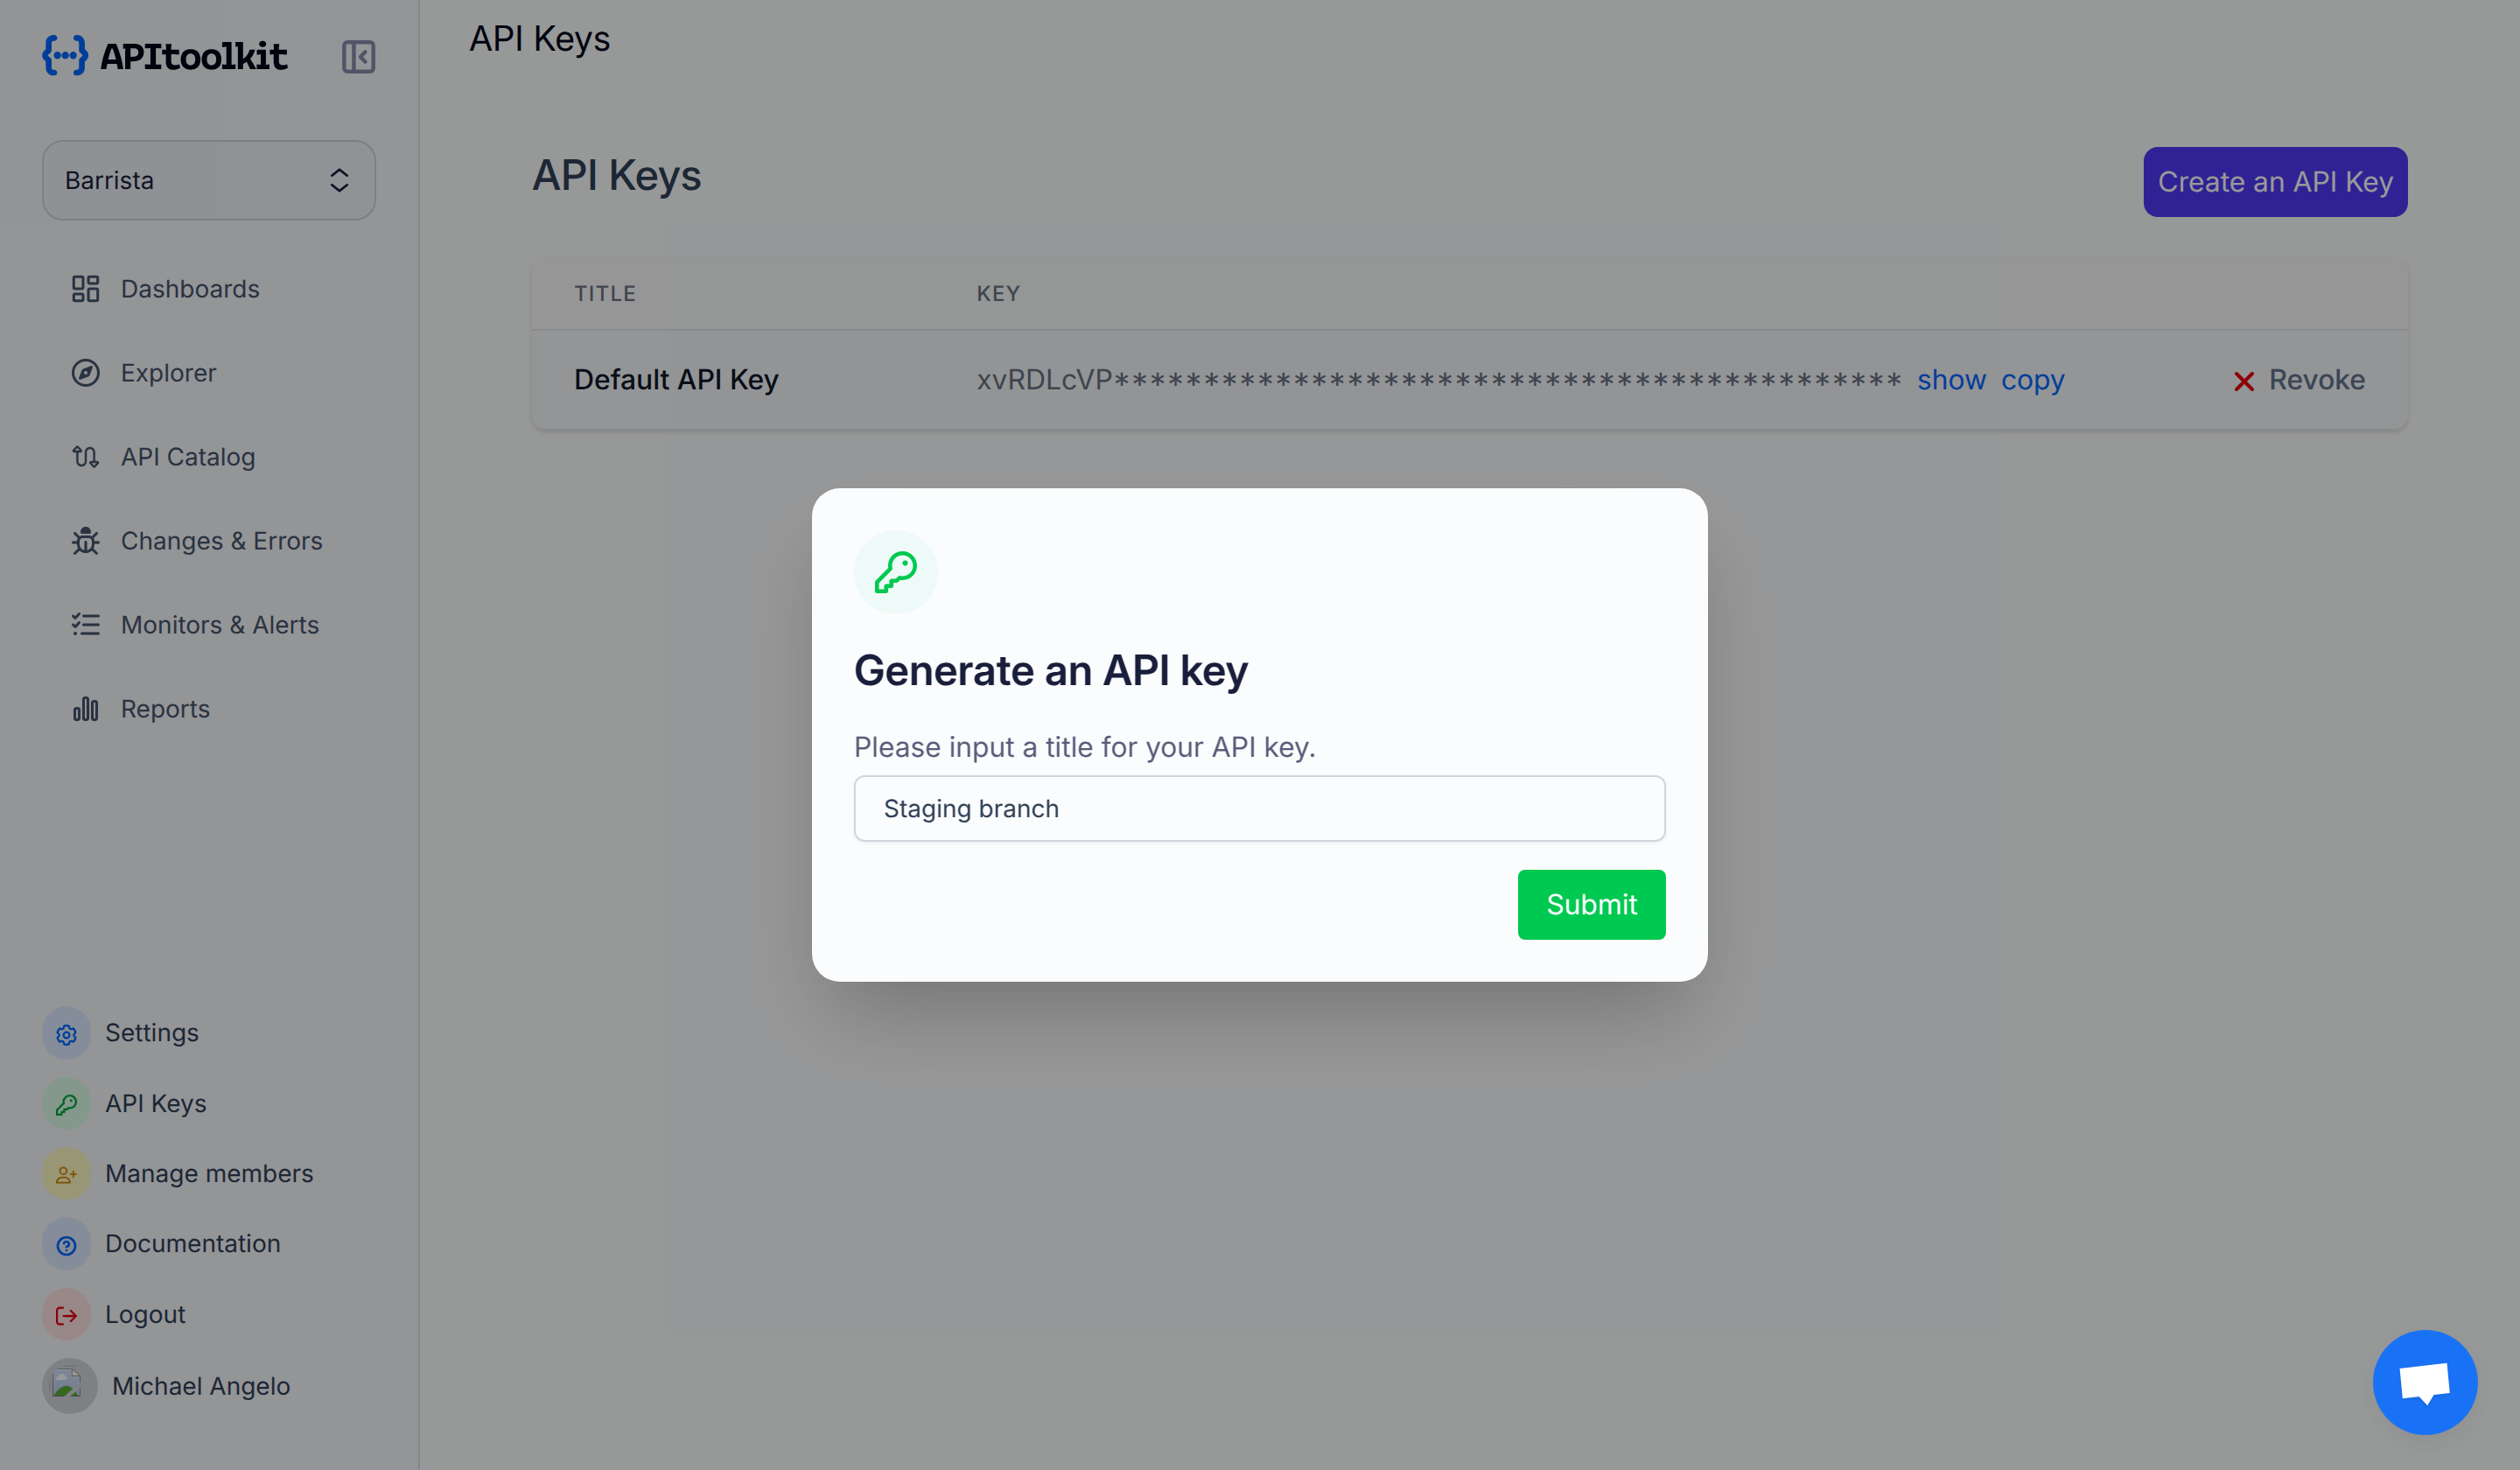
Create separate API keys for each environment (development, staging, production) to keep your data isolated.
④ Integrate an SDK
Add a Monoscope SDK to your application to start sending telemetry data. We have native SDKs for 17+ frameworks, plus OpenTelemetry support for any language.
Find your framework in the SDK Guides: Node.js, Python, Go, PHP, .NET, Java, and more. If your language isn't listed, use OpenTelemetry to integrate directly.
Need help? Email us and we’ll get you set up.
⑤ Test Your Integration
Verify everything works before deploying. No extra tools needed — the CLI handles it.
Single event — instant confirmation:
monoscope send-event -m "Hello from Monoscope"
Open the dashboard and search for your message in the Log Explorer. If it appears, your pipeline is working end-to-end.
Sustained load — stress-test the pipeline:
monoscope telemetrygen --kind=trace --rate=5 --count=50 --service=my-service
Useful for verifying ingestion at volume before a real deploy.
send-event options
-
-m TEXT: Message (repeatable — multiple-mlines join into one event) -
--level debug|info|warn|error: Severity (default:info) -
--service NAME: Service name shown in the dashboard -
-t KEY:VALUE: Tag attribute, repeatable -
-e KEY:VALUE: Extra attribute, repeatable -
-r KEY:VALUE: Resource attribute (e.g.service.version:1.2.0), repeatable
telemetrygen options
-
--kind trace|log|metric: Type of telemetry (default:trace) -
--rate N: Events per second (default:1) -
--count N: Total to send — omit to run continuously -
--service NAME: Service name (default:telemetrygen) -
-r KEY:VALUE: Resource attribute, repeatable
Check the API Log Explorer in your dashboard — events should appear within a few seconds.
⑥ Acknowledge Endpoints or Anomalies
As Monoscope receives traffic, it auto-detects your API endpoints (visible in Explorer) and anomalies (visible in Changes & Errors). Acknowledge each endpoint to tell Monoscope what’s expected — this enables accurate anomaly detection and scheduled reports.
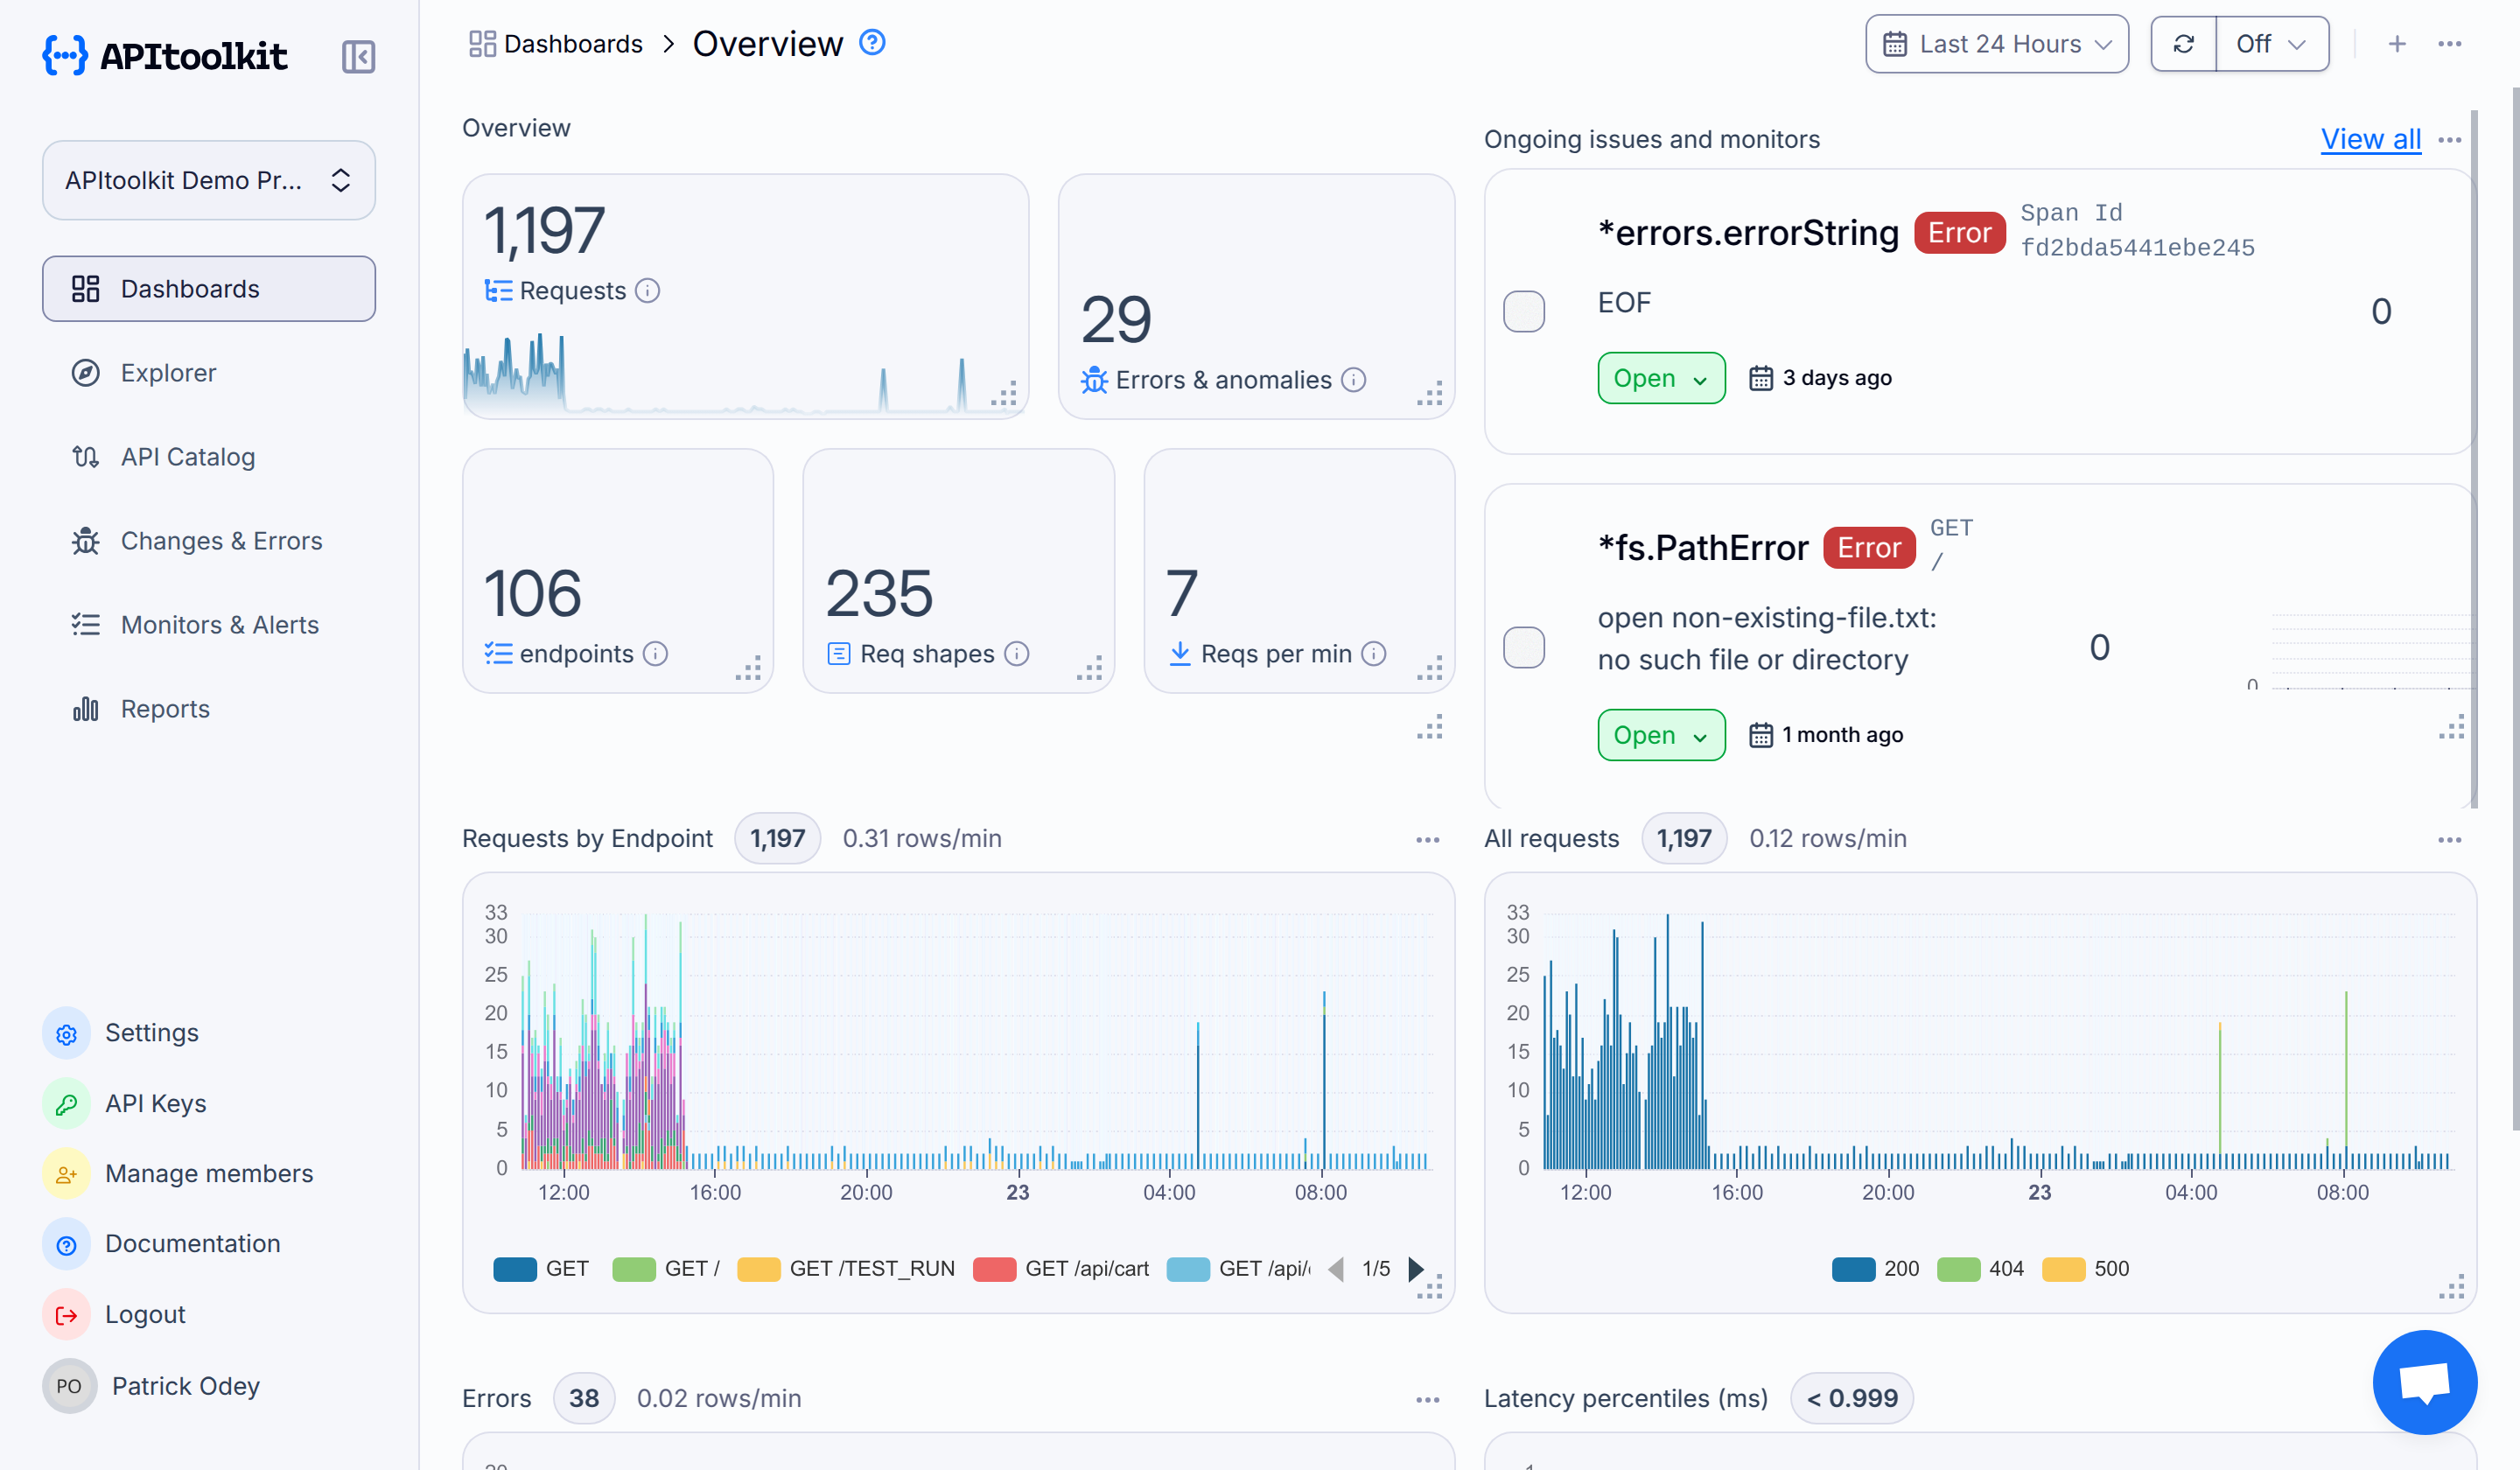
Dashboard Overview
| Tab | What it does |
|---|---|
| Get Started | Onboarding checklist for your integration |
| Dashboard | Analytics overview: requests, anomalies, latency, and errors |
| Endpoints | All detected API endpoints |
| API Log Explorer | Search and filter request logs, create alerts |
| Changes & Errors | Detected anomalies and errors |
| Outgoing Integrations | External API calls your service makes |
| API Tests | Create and schedule HTTP response validation tests |
| Reports | Email report history and frequency settings |
Next Steps
SDK Guides
Native SDKs for Node.js, Python, Go, PHP, .NET, and 12+ more frameworks.Dashboard Guides
Explore endpoints, logs, anomalies, tests, and analytics in the dashboard.CLI & Agents
Drive Monoscope from the terminal — and let Claude Code skills triage incidents end-to-end.Prefer terminal-first? Install the CLI and run monoscope auth login instead of clicking through the dashboard. Install & authenticate guide →